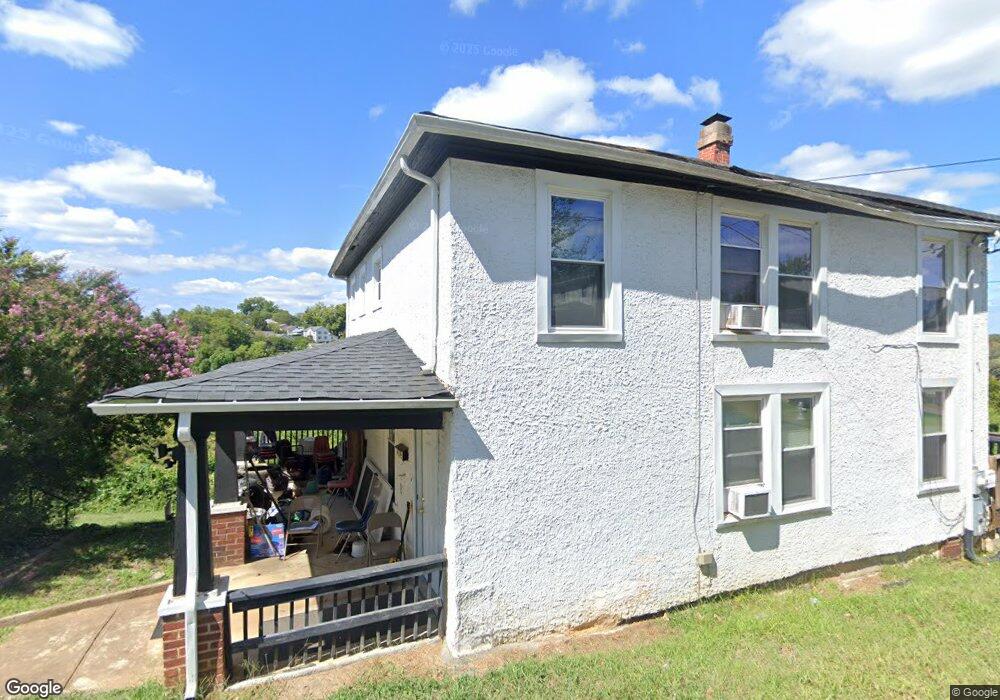
201 I St Lynchburg, VA 24504
Daniel's Hill NeighborhoodEstimated Value: $147,000 - $226,000
5
Beds
2
Baths
1,860
Sq Ft
$99/Sq Ft
Est. Value
About This Home
This home is located at 201 I St, Lynchburg, VA 24504 and is currently estimated at $185,022, approximately $99 per square foot. 201 I St is a home located in Lynchburg City with nearby schools including Linkhorne Elementary School, Linkhorne Middle School, and E.C. Glass High School.
Ownership History
Date
Name
Owned For
Owner Type
Purchase Details
Closed on
Jun 28, 2011
Sold by
Oesterling Raymond L
Bought by
Roberson Teresa
Current Estimated Value
Home Financials for this Owner
Home Financials are based on the most recent Mortgage that was taken out on this home.
Original Mortgage
$7,050
Outstanding Balance
$4,849
Interest Rate
4.58%
Mortgage Type
Stand Alone Second
Estimated Equity
$180,173
Purchase Details
Closed on
Jun 8, 2007
Sold by
Hicks Robert Lee
Bought by
Oesterling Raymond L
Create a Home Valuation Report for This Property
The Home Valuation Report is an in-depth analysis detailing your home's value as well as a comparison with similar homes in the area
Home Values in the Area
Average Home Value in this Area
Purchase History
| Date | Buyer | Sale Price | Title Company |
|---|---|---|---|
| Roberson Teresa | $65,150 | Integrity Title & Settlement | |
| Oesterling Raymond L | -- | None Available |
Source: Public Records
Mortgage History
| Date | Status | Borrower | Loan Amount |
|---|---|---|---|
| Open | Roberson Teresa | $7,050 | |
| Open | Roberson Teresa | $63,497 |
Source: Public Records
Tax History Compared to Growth
Tax History
| Year | Tax Paid | Tax Assessment Tax Assessment Total Assessment is a certain percentage of the fair market value that is determined by local assessors to be the total taxable value of land and additions on the property. | Land | Improvement |
|---|---|---|---|---|
| 2025 | $962 | $114,500 | $26,000 | $88,500 |
| 2024 | $775 | $87,100 | $19,500 | $67,600 |
| 2023 | $775 | $87,100 | $19,500 | $67,600 |
| 2022 | $758 | $73,600 | $9,000 | $64,600 |
| 2021 | $817 | $73,600 | $9,000 | $64,600 |
| 2020 | $761 | $68,600 | $6,000 | $62,600 |
| 2019 | $761 | $68,600 | $6,000 | $62,600 |
| 2018 | $750 | $67,600 | $6,000 | $61,600 |
| 2017 | $750 | $67,600 | $6,000 | $61,600 |
| 2016 | $750 | $67,600 | $6,000 | $61,600 |
| 2015 | $750 | $65,800 | $3,000 | $62,800 |
| 2014 | $730 | $69,100 | $3,000 | $66,100 |
Source: Public Records
Map
Nearby Homes