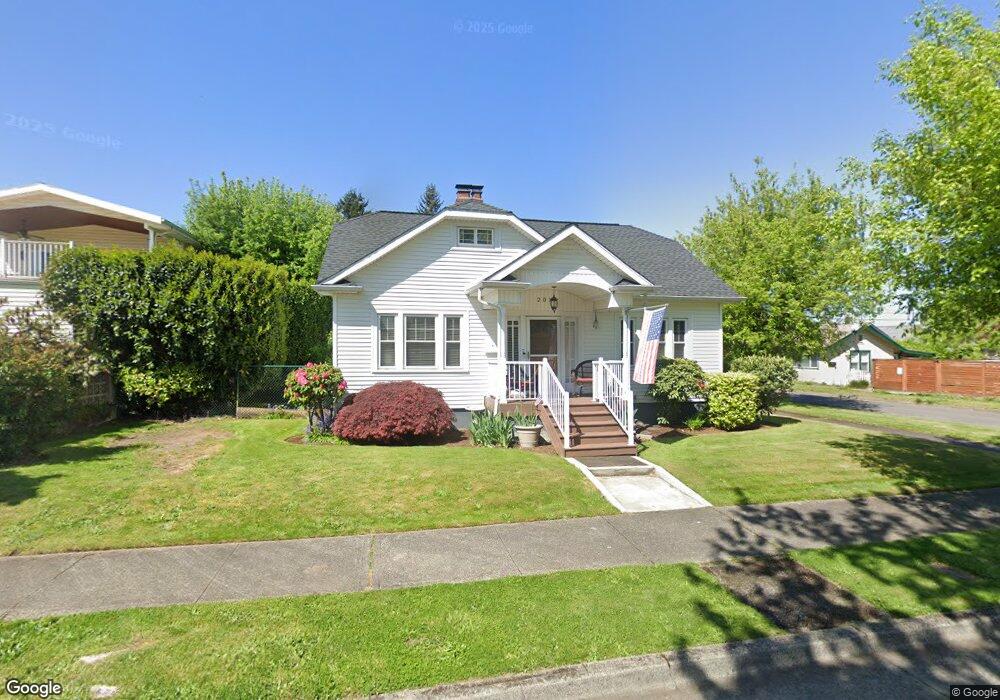
201 I St SE Auburn, WA 98002
Downtown Auburn NeighborhoodEstimated Value: $459,000 - $540,000
4
Beds
1
Bath
1,420
Sq Ft
$346/Sq Ft
Est. Value
About This Home
This home is located at 201 I St SE, Auburn, WA 98002 and is currently estimated at $490,621, approximately $345 per square foot. 201 I St SE is a home located in King County with nearby schools including Washington Elementary School, Cascade Middle School, and Auburn High School.
Ownership History
Date
Name
Owned For
Owner Type
Purchase Details
Closed on
Aug 3, 2001
Sold by
Johnston Jackie L and Carothers Jackie L
Bought by
Johnston John and Johnston Jackie L
Current Estimated Value
Home Financials for this Owner
Home Financials are based on the most recent Mortgage that was taken out on this home.
Original Mortgage
$156,000
Outstanding Balance
$60,633
Interest Rate
7.1%
Estimated Equity
$429,988
Purchase Details
Closed on
Jun 10, 1998
Sold by
Prenovost Neal J
Bought by
Carothers Jackie L
Home Financials for this Owner
Home Financials are based on the most recent Mortgage that was taken out on this home.
Original Mortgage
$122,400
Interest Rate
7.17%
Create a Home Valuation Report for This Property
The Home Valuation Report is an in-depth analysis detailing your home's value as well as a comparison with similar homes in the area
Home Values in the Area
Average Home Value in this Area
Purchase History
| Date | Buyer | Sale Price | Title Company |
|---|---|---|---|
| Johnston John | -- | Fidelity National Title | |
| Carothers Jackie L | $136,000 | Evergreen Title Company Inc |
Source: Public Records
Mortgage History
| Date | Status | Borrower | Loan Amount |
|---|---|---|---|
| Open | Johnston John | $156,000 | |
| Previous Owner | Carothers Jackie L | $122,400 |
Source: Public Records
Tax History Compared to Growth
Tax History
| Year | Tax Paid | Tax Assessment Tax Assessment Total Assessment is a certain percentage of the fair market value that is determined by local assessors to be the total taxable value of land and additions on the property. | Land | Improvement |
|---|---|---|---|---|
| 2024 | $5,567 | $459,000 | $127,000 | $332,000 |
| 2023 | $4,949 | $404,000 | $102,000 | $302,000 |
| 2022 | $4,561 | $422,000 | $111,000 | $311,000 |
| 2021 | $4,388 | $335,000 | $89,000 | $246,000 |
| 2020 | $4,016 | $305,000 | $83,000 | $222,000 |
| 2018 | $3,911 | $274,000 | $80,000 | $194,000 |
| 2017 | $3,529 | $243,000 | $73,000 | $170,000 |
| 2016 | $3,106 | $219,000 | $70,000 | $149,000 |
| 2015 | $3,060 | $204,000 | $65,000 | $139,000 |
| 2014 | -- | $195,000 | $62,000 | $133,000 |
| 2013 | -- | $149,000 | $57,000 | $92,000 |
Source: Public Records
Map
Nearby Homes