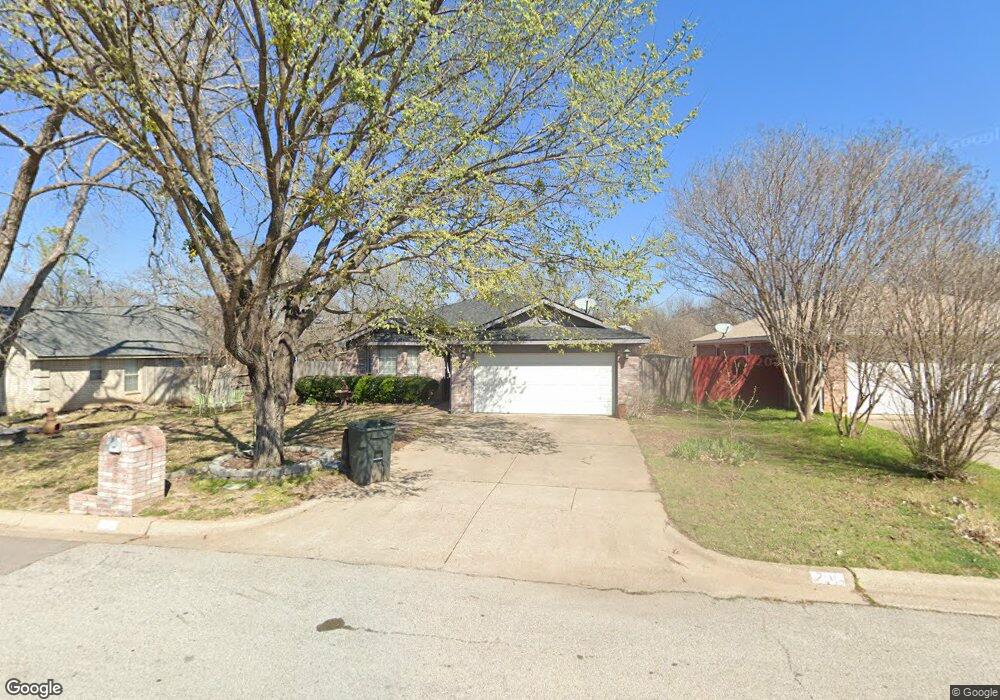
201 King Arthur Dr Weatherford, TX 76086
Estimated Value: $279,112 - $309,000
3
Beds
2
Baths
1,491
Sq Ft
$193/Sq Ft
Est. Value
About This Home
This home is located at 201 King Arthur Dr, Weatherford, TX 76086 and is currently estimated at $288,028, approximately $193 per square foot. 201 King Arthur Dr is a home located in Parker County with nearby schools including Austin Elementary School, Hall Middle School, and Weatherford High School.
Ownership History
Date
Name
Owned For
Owner Type
Purchase Details
Closed on
Jun 15, 2022
Sold by
Lynn Ballard Kris
Bought by
Terry Waymon and Terry Jane Shirie
Current Estimated Value
Purchase Details
Closed on
Oct 26, 2007
Sold by
Kirkham Natalie J and Kirkham Wayne T
Bought by
Barnett Glenn H and Barnett Glenda J
Purchase Details
Closed on
Sep 12, 2000
Sold by
Johnson Darin L and Johnson Sri Y
Bought by
Barnett Glenn H and Barnett Glenda J
Purchase Details
Closed on
Mar 26, 1998
Bought by
Barnett Glenn H and Barnett Glenda J
Purchase Details
Closed on
Aug 4, 1995
Bought by
Barnett Glenn H and Barnett Glenda J
Purchase Details
Closed on
Nov 2, 1992
Bought by
Barnett Glenn H and Barnett Glenda J
Purchase Details
Closed on
Jan 1, 1901
Bought by
Barnett Glenn H and Barnett Glenda J
Create a Home Valuation Report for This Property
The Home Valuation Report is an in-depth analysis detailing your home's value as well as a comparison with similar homes in the area
Home Values in the Area
Average Home Value in this Area
Purchase History
| Date | Buyer | Sale Price | Title Company |
|---|---|---|---|
| Terry Waymon | -- | Trinity Title | |
| Barnett Glenn H | -- | Alamo Title | |
| Barnett Glenn H | -- | -- | |
| Barnett Glenn H | -- | -- | |
| Barnett Glenn H | -- | -- | |
| Barnett Glenn H | -- | -- | |
| Barnett Glenn H | -- | -- |
Source: Public Records
Tax History Compared to Growth
Tax History
| Year | Tax Paid | Tax Assessment Tax Assessment Total Assessment is a certain percentage of the fair market value that is determined by local assessors to be the total taxable value of land and additions on the property. | Land | Improvement |
|---|---|---|---|---|
| 2025 | $3,896 | $253,350 | $50,000 | $203,350 |
| 2024 | $3,896 | $270,690 | $40,000 | $230,690 |
| 2023 | $3,896 | $270,690 | $40,000 | $230,690 |
| 2022 | $4,061 | $183,070 | $25,000 | $158,070 |
| 2021 | $4,148 | $183,070 | $25,000 | $158,070 |
| 2020 | $3,794 | $157,040 | $25,000 | $132,040 |
| 2019 | $3,670 | $157,040 | $25,000 | $132,040 |
| 2018 | $3,351 | $130,650 | $20,000 | $110,650 |
| 2017 | $3,426 | $130,650 | $20,000 | $110,650 |
| 2016 | $3,114 | $118,360 | $20,000 | $98,360 |
| 2015 | $2,027 | $118,360 | $20,000 | $98,360 |
| 2014 | $2,121 | $109,580 | $20,000 | $89,580 |
Source: Public Records
Map
Nearby Homes
- 207 Camelot Dr
- 101 Black Forest Dr
- 2004 Hill Crest Ct
- 118 Black Forest Dr
- 128 Black Forest Dr
- 905 Terry Trail
- 2001 Santa fe Dr
- 307 Hickory Ln
- 305 Hickory Ln
- 1017 Inverness Dr
- The Chisholm Plan at Hickory Place Addition
- 936 Eldorado St
- 1628 Holland Lake Dr
- 934 Eldorado St
- 1029 Inverness Dr
- 1234 Newcastle Dr
- 107 Hickory Ln
- 916 El Dorado St
- Horseshoe Bend Rd
- 0 Adell Cir
- 205 King Arthur Dr
- 117 King Arthur Dr
- 209 King Arthur Dr
- 115 King Arthur Dr
- 237 Merlin Dr
- 220 Guinevere Dr
- 213 King Arthur Dr
- 113 King Arthur Dr
- 233 Merlin Dr
- 218 Guinevere Dr
- 238 Merlin Dr
- 217 King Arthur Dr
- 215 Guinevere Dr
- 111 King Arthur Dr
- 234 Merlin Dr
- 216 Guinevere Dr
- 229 Merlin Dr
- 213 Guinevere Dr
- 221 King Arthur Dr
- 233 Lancelot Dr