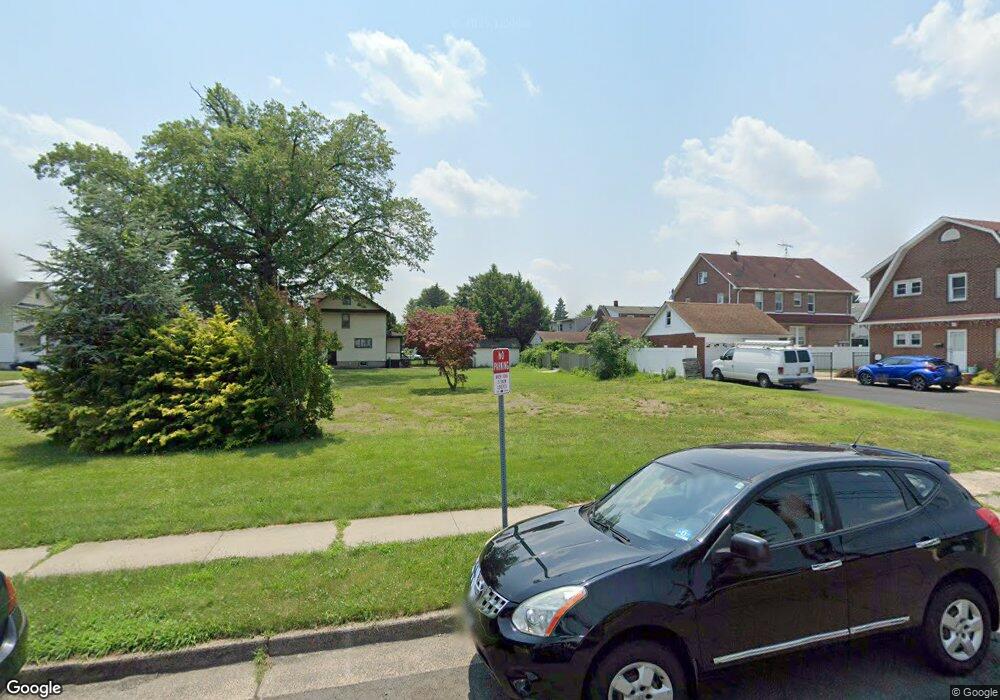
201 Knopf St Manville, NJ 08835
Estimated Value: $252,000
--
Bed
--
Bath
1,920
Sq Ft
$131/Sq Ft
Est. Value
About This Home
This home is located at 201 Knopf St, Manville, NJ 08835 and is currently priced at $252,000, approximately $131 per square foot. 201 Knopf St is a home located in Somerset County with nearby schools including Weston Elementary School, Roosevelt School, and Alexander Batcho Intermediate School (ABIS).
Ownership History
Date
Name
Owned For
Owner Type
Purchase Details
Closed on
Sep 26, 2016
Sold by
Seiwell Catherine
Bought by
Borough Of Manville
Current Estimated Value
Purchase Details
Closed on
Jul 31, 2001
Sold by
Wallace Robert
Bought by
Seiwell Catherine
Home Financials for this Owner
Home Financials are based on the most recent Mortgage that was taken out on this home.
Original Mortgage
$138,829
Interest Rate
7.1%
Create a Home Valuation Report for This Property
The Home Valuation Report is an in-depth analysis detailing your home's value as well as a comparison with similar homes in the area
Home Values in the Area
Average Home Value in this Area
Purchase History
| Date | Buyer | Sale Price | Title Company |
|---|---|---|---|
| Borough Of Manville | $228,000 | Aston Title Group Llc | |
| Seiwell Catherine | $154,255 | -- |
Source: Public Records
Mortgage History
| Date | Status | Borrower | Loan Amount |
|---|---|---|---|
| Previous Owner | Seiwell Catherine | $138,829 |
Source: Public Records
Tax History Compared to Growth
Tax History
| Year | Tax Paid | Tax Assessment Tax Assessment Total Assessment is a certain percentage of the fair market value that is determined by local assessors to be the total taxable value of land and additions on the property. | Land | Improvement |
|---|---|---|---|---|
| 2025 | -- | $153,000 | $153,000 | -- |
| 2024 | -- | $118,000 | $118,000 | $0 |
| 2023 | -- | $108,000 | $108,000 | $0 |
| 2022 | -- | $108,000 | $108,000 | $0 |
| 2021 | $0 | $108,000 | $108,000 | $0 |
| 2020 | $0 | $98,000 | $98,000 | $0 |
| 2019 | $9,331 | $98,000 | $98,000 | $0 |
| 2018 | $0 | $108,000 | $108,000 | $0 |
| 2017 | $0 | $301,200 | $102,600 | $198,600 |
| 2016 | $9,331 | $301,200 | $102,600 | $198,600 |
| 2015 | $6,768 | $280,000 | $143,500 | $136,500 |
| 2014 | $6,633 | $280,000 | $143,500 | $136,500 |
Source: Public Records
Map
Nearby Homes