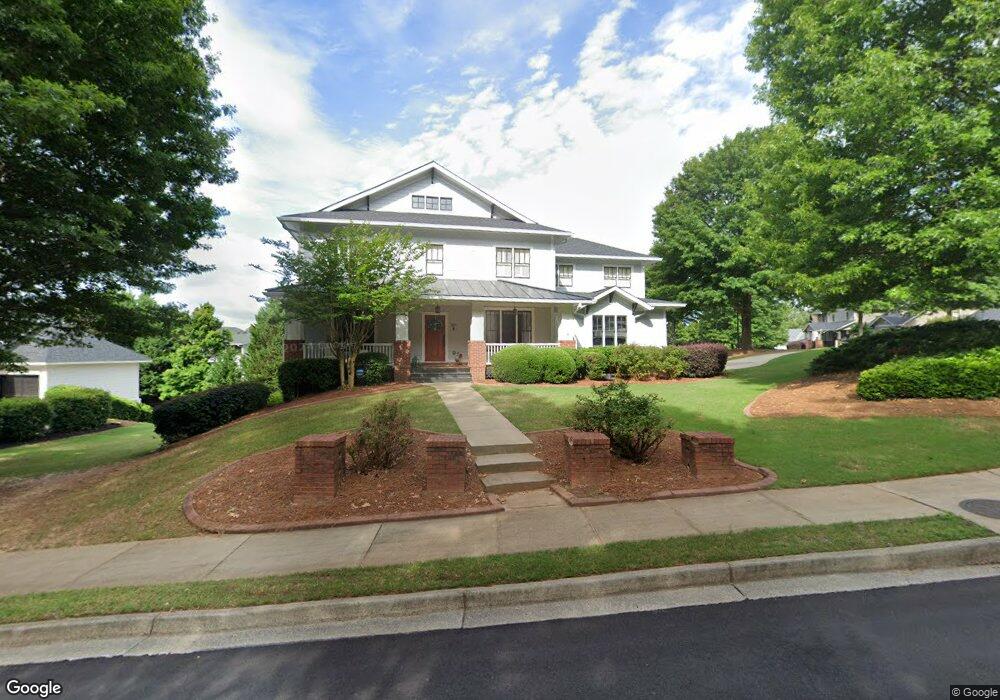
201 Kobuk Ct Unit E6 Canton, GA 30114
Estimated Value: $744,596 - $784,000
5
Beds
5
Baths
5,037
Sq Ft
$152/Sq Ft
Est. Value
About This Home
This home is located at 201 Kobuk Ct Unit E6, Canton, GA 30114 and is currently estimated at $764,298, approximately $151 per square foot. 201 Kobuk Ct Unit E6 is a home located in Cherokee County with nearby schools including J. Knox Elementary School, Teasley Middle School, and Cherokee High School.
Ownership History
Date
Name
Owned For
Owner Type
Purchase Details
Closed on
Dec 13, 2021
Sold by
Modrzynski Jacob Michael
Bought by
Krenek Hunter S and Krenek Lauren Holland
Current Estimated Value
Purchase Details
Closed on
Nov 13, 2020
Sold by
Beal Jesse L
Bought by
Modrzynski Jacob Michael and Modrzynski Rita Marie
Home Financials for this Owner
Home Financials are based on the most recent Mortgage that was taken out on this home.
Original Mortgage
$494,000
Interest Rate
2.8%
Mortgage Type
New Conventional
Purchase Details
Closed on
Jun 1, 2004
Sold by
Cri Homes Inc
Bought by
Beal Jesse L and Beal Leslie
Home Financials for this Owner
Home Financials are based on the most recent Mortgage that was taken out on this home.
Original Mortgage
$368,640
Interest Rate
4%
Mortgage Type
New Conventional
Create a Home Valuation Report for This Property
The Home Valuation Report is an in-depth analysis detailing your home's value as well as a comparison with similar homes in the area
Home Values in the Area
Average Home Value in this Area
Purchase History
| Date | Buyer | Sale Price | Title Company |
|---|---|---|---|
| Krenek Hunter S | $590,000 | -- | |
| Modrzynski Jacob Michael | $520,000 | -- | |
| Beal Jesse L | $409,600 | -- |
Source: Public Records
Mortgage History
| Date | Status | Borrower | Loan Amount |
|---|---|---|---|
| Previous Owner | Modrzynski Jacob Michael | $494,000 | |
| Previous Owner | Beal Jesse L | $368,640 |
Source: Public Records
Tax History Compared to Growth
Tax History
| Year | Tax Paid | Tax Assessment Tax Assessment Total Assessment is a certain percentage of the fair market value that is determined by local assessors to be the total taxable value of land and additions on the property. | Land | Improvement |
|---|---|---|---|---|
| 2024 | $7,788 | $290,080 | $54,000 | $236,080 |
| 2023 | $6,821 | $269,640 | $52,000 | $217,640 |
| 2022 | $6,363 | $229,240 | $40,000 | $189,240 |
| 2021 | $6,028 | $197,680 | $30,200 | $167,480 |
| 2020 | $4,728 | $156,960 | $26,600 | $130,360 |
| 2019 | $4,724 | $156,720 | $26,600 | $130,120 |
| 2018 | $4,578 | $151,120 | $31,200 | $119,920 |
| 2017 | $3,717 | $367,200 | $31,200 | $115,680 |
| 2016 | $3,717 | $367,600 | $31,200 | $115,840 |
| 2015 | $3,646 | $357,600 | $31,200 | $111,840 |
| 2014 | $4,349 | $342,700 | $24,000 | $113,080 |
Source: Public Records
Map
Nearby Homes
- 305 Arlington Cir
- 619 River Bend Way
- 609 Arches Park Ln
- 866 Lakemont Dr
- 1243 Lakeside Overlook
- 107 Clubhouse Ln
- 845 Lakemont Dr
- The Morgan Plan at River Green - Lakeside
- The Garland Plan at River Green - Lakeside
- The Greenbrier Plan at River Green - Lakeside
- The Greenwood Plan at River Green - Lakeside
- The Mayfield Plan at River Green - Lakeside
- The Etowah Plan at River Green - Lakeside
- The Madison Plan at River Green - Lakeside
- The Benton Plan at River Green - Lakeside
- The Monroe Plan at River Green - Lakeside
- The Bentley Plan at River Green - Lakeside
- 1209 Lakeside Overlook
- 208 Westbury Ct
- 302 Grant Ct
- 201 Kobuk Ct
- 301 Arlington Cir
- 633 River Bend Way
- 0 Kobuk Ct Unit 7224869
- 0 Kobuk Ct Unit 8130632
- 0 Kobuk Ct Unit 7112554
- 0 Kobuk Ct Unit 8394377
- 0 Kobuk Ct Unit 3272495
- 0 Kobuk Ct Unit 7265033
- 0 Kobuk Ct Unit 8780412
- 0 Kobuk Ct
- 303 Arlington Cir
- 200 Kobuk Ct
- 603 Redwood Park Cir
- 631 River Bend Way
- 202 Kobuk Ct
- 400 N Cascades Cir
- 0 Arlington Cir Unit 7300799
- 0 Arlington Cir Unit 7399678
- 0 Arlington Cir Unit 7061785