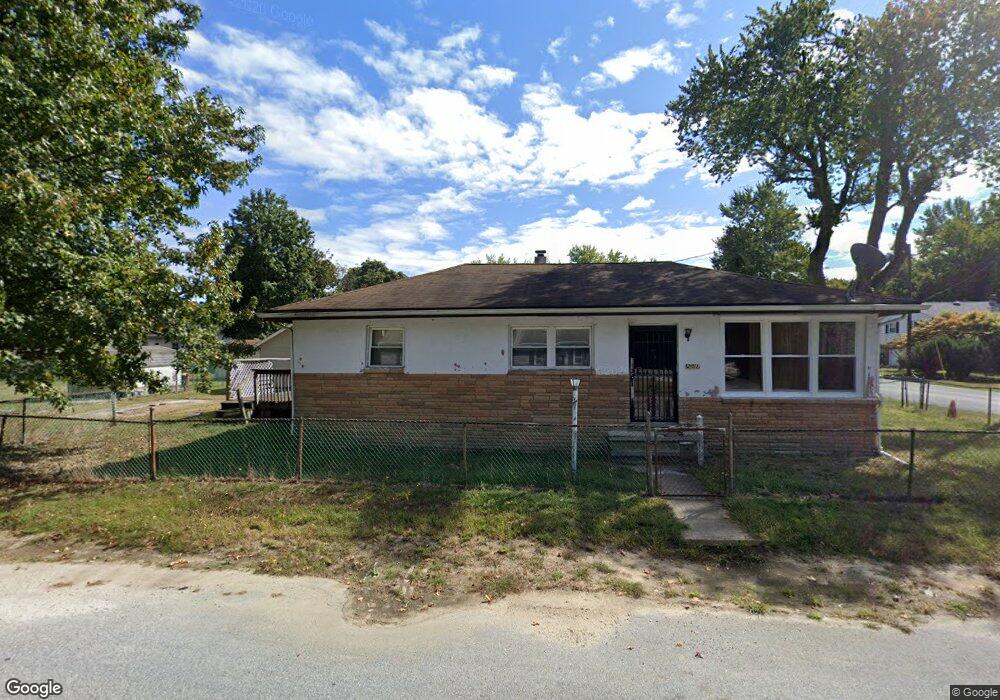
201 Lanning Ave Penns Grove, NJ 08069
Estimated Value: $171,956 - $235,000
--
Bed
--
Bath
1,120
Sq Ft
$182/Sq Ft
Est. Value
About This Home
This home is located at 201 Lanning Ave, Penns Grove, NJ 08069 and is currently estimated at $203,489, approximately $181 per square foot. 201 Lanning Ave is a home located in Salem County with nearby schools including Lafayette-Pershing Elementary School, Field Street Elementary School, and Paul W. Carleton Elementary School.
Ownership History
Date
Name
Owned For
Owner Type
Purchase Details
Closed on
Nov 2, 2000
Sold by
Hud
Bought by
Richardson John R
Current Estimated Value
Purchase Details
Closed on
Jun 30, 2000
Sold by
Green Michael B and Green Jennifer
Bought by
Hud
Purchase Details
Closed on
Aug 29, 1997
Sold by
Underwood Peggy Moore
Bought by
Green Michael B
Home Financials for this Owner
Home Financials are based on the most recent Mortgage that was taken out on this home.
Original Mortgage
$54,959
Interest Rate
7.31%
Mortgage Type
FHA
Create a Home Valuation Report for This Property
The Home Valuation Report is an in-depth analysis detailing your home's value as well as a comparison with similar homes in the area
Home Values in the Area
Average Home Value in this Area
Purchase History
| Date | Buyer | Sale Price | Title Company |
|---|---|---|---|
| Richardson John R | $38,000 | Surety Title Corporation | |
| Hud | -- | -- | |
| Green Michael B | $55,000 | Intercoastal Title Agency In |
Source: Public Records
Mortgage History
| Date | Status | Borrower | Loan Amount |
|---|---|---|---|
| Previous Owner | Green Michael B | $54,959 |
Source: Public Records
Tax History Compared to Growth
Tax History
| Year | Tax Paid | Tax Assessment Tax Assessment Total Assessment is a certain percentage of the fair market value that is determined by local assessors to be the total taxable value of land and additions on the property. | Land | Improvement |
|---|---|---|---|---|
| 2025 | $3,543 | $172,200 | $49,500 | $122,700 |
| 2024 | $3,421 | $96,100 | $28,200 | $67,900 |
| 2023 | $3,421 | $96,100 | $28,200 | $67,900 |
| 2022 | $3,219 | $96,100 | $28,200 | $67,900 |
| 2021 | $3,189 | $96,100 | $28,200 | $67,900 |
| 2020 | $3,216 | $96,100 | $28,200 | $67,900 |
| 2019 | $3,243 | $96,100 | $28,200 | $67,900 |
| 2018 | $3,228 | $102,500 | $31,000 | $71,500 |
| 2017 | $3,009 | $102,500 | $31,000 | $71,500 |
| 2016 | $3,338 | $118,000 | $36,000 | $82,000 |
| 2015 | $3,182 | $118,000 | $36,000 | $82,000 |
| 2014 | $3,013 | $118,000 | $36,000 | $82,000 |
Source: Public Records
Map
Nearby Homes