201 Legacy Park Dr Lithia Springs, GA 30122
Lithia Springs NeighborhoodEstimated Value: $269,000 - $413,000
3
Beds
2
Baths
2,030
Sq Ft
$166/Sq Ft
Est. Value
About This Home
This home is located at 201 Legacy Park Dr, Lithia Springs, GA 30122 and is currently estimated at $336,226, approximately $165 per square foot. 201 Legacy Park Dr is a home located in Douglas County with nearby schools including Factory Shoals Elementary School, Factory Shoals Middle School, and New Manchester High School.
Ownership History
Date
Name
Owned For
Owner Type
Purchase Details
Closed on
Nov 26, 2019
Sold by
Legacy Park Holdings Llc
Bought by
Collins Debra
Current Estimated Value
Home Financials for this Owner
Home Financials are based on the most recent Mortgage that was taken out on this home.
Original Mortgage
$213,750
Outstanding Balance
$187,393
Interest Rate
3.7%
Mortgage Type
New Conventional
Estimated Equity
$148,833
Purchase Details
Closed on
Oct 30, 2019
Sold by
Legacy Park Holdings Llc
Bought by
Estate Partners Llc and Knowledge Equities Llc Etal
Home Financials for this Owner
Home Financials are based on the most recent Mortgage that was taken out on this home.
Original Mortgage
$213,750
Outstanding Balance
$187,393
Interest Rate
3.7%
Mortgage Type
New Conventional
Estimated Equity
$148,833
Purchase Details
Closed on
Nov 5, 2013
Sold by
Legacy Park Partners Llc
Bought by
State Bank And Trust Co
Create a Home Valuation Report for This Property
The Home Valuation Report is an in-depth analysis detailing your home's value as well as a comparison with similar homes in the area
Home Values in the Area
Average Home Value in this Area
Purchase History
| Date | Buyer | Sale Price | Title Company |
|---|---|---|---|
| Collins Debra | $225,000 | -- | |
| Estate Partners Llc | -- | -- | |
| State Bank And Trust Co | $980,000 | -- |
Source: Public Records
Mortgage History
| Date | Status | Borrower | Loan Amount |
|---|---|---|---|
| Open | Collins Debra | $213,750 |
Source: Public Records
Tax History Compared to Growth
Tax History
| Year | Tax Paid | Tax Assessment Tax Assessment Total Assessment is a certain percentage of the fair market value that is determined by local assessors to be the total taxable value of land and additions on the property. | Land | Improvement |
|---|---|---|---|---|
| 2024 | $978 | $98,120 | $20,000 | $78,120 |
| 2023 | $978 | $98,120 | $20,000 | $78,120 |
| 2022 | $1,019 | $98,120 | $20,000 | $78,120 |
| 2021 | $1,019 | $94,960 | $23,000 | $71,960 |
| 2020 | $1,026 | $89,520 | $14,400 | $75,120 |
| 2019 | $2,696 | $87,080 | $14,400 | $72,680 |
| 2018 | $2,133 | $68,560 | $0 | $68,560 |
| 2017 | $2,552 | $94,641 | $1 | $94,640 |
| 2016 | $2,930 | $90,801 | $1 | $90,800 |
| 2015 | $2,411 | $33,200 | $0 | $33,200 |
| 2014 | $2,411 | $71,761 | $1 | $71,760 |
| 2013 | -- | $72,080 | $0 | $72,080 |
Source: Public Records
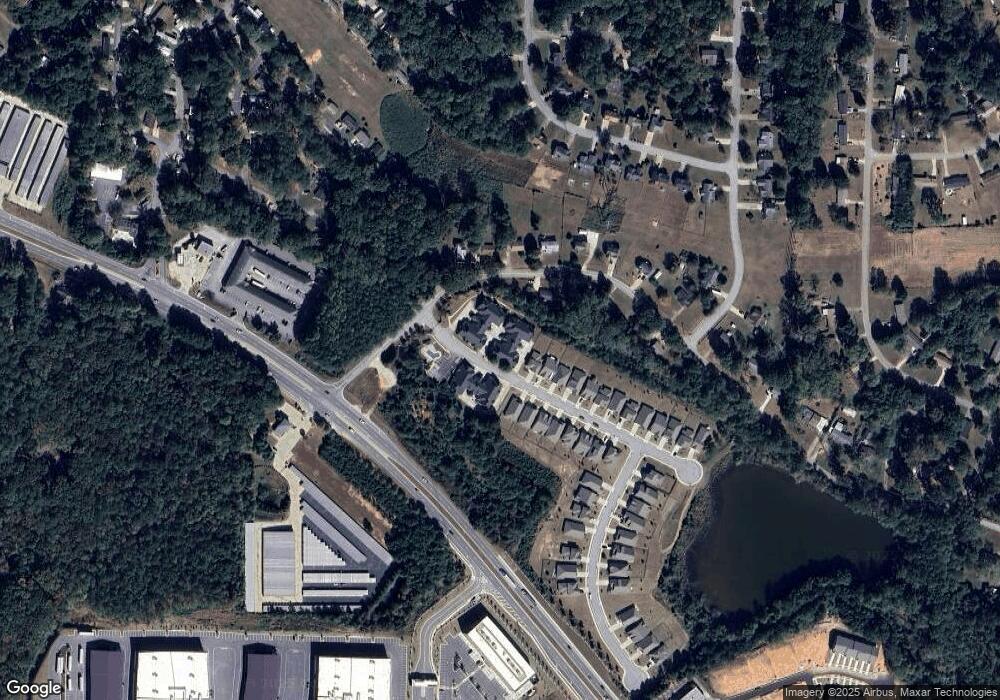
Map
Nearby Homes
- 2808 Lillian Ln
- 8767 Northview Dr
- 2390 Fairburn Rd Unit 237
- 8767 N View Dr
- 2820 Maxwell Place
- 2732 Montie Ct
- 2740 Montie Ct
- 2741 Montie Ct
- 3957 Fairhaven Rd
- 2756 Montie Ct
- 3964 Fairhaven Rd
- 3924 Fairhaven Rd
- 3940 Fairhaven Rd
- 3948 Fairhaven Rd
- 2562 Fairburn Rd
- 2715 Whisper Trail
- 3060 Wilkes Plantation Way
- 2645 Whisper Trail
- 2655 Whisper Trail
- 3636 Meadowview Dr
- 201 Legacy Park Dr Unit 102
- 201 Legacy Park Dr Unit 201
- 201 Legacy Park Dr
- 204 Legacy Park Dr
- 202 Legacy Park Dr
- 104 Legacy Park Dr Unit 104
- 104 Legacy Park Dr
- 104 Legacy Park Dr
- 203 Legacy Park Dr
- 103 Legacy Park Dr Unit 103
- 2998 Legacy Park Dr
- 2101 Legacy Park Dr Unit 2104
- 2101 Legacy Park Dr
- 101 Legacy Park Dr Unit 101
- 101 Legacy Park Dr
- 101 Legacy Park Dr
- 2104 Legacy Park Dr Unit 2101
- 2104 Legacy Park Dr
- 102 Legacy Park Dr Unit 102
- 102 Legacy Park Dr