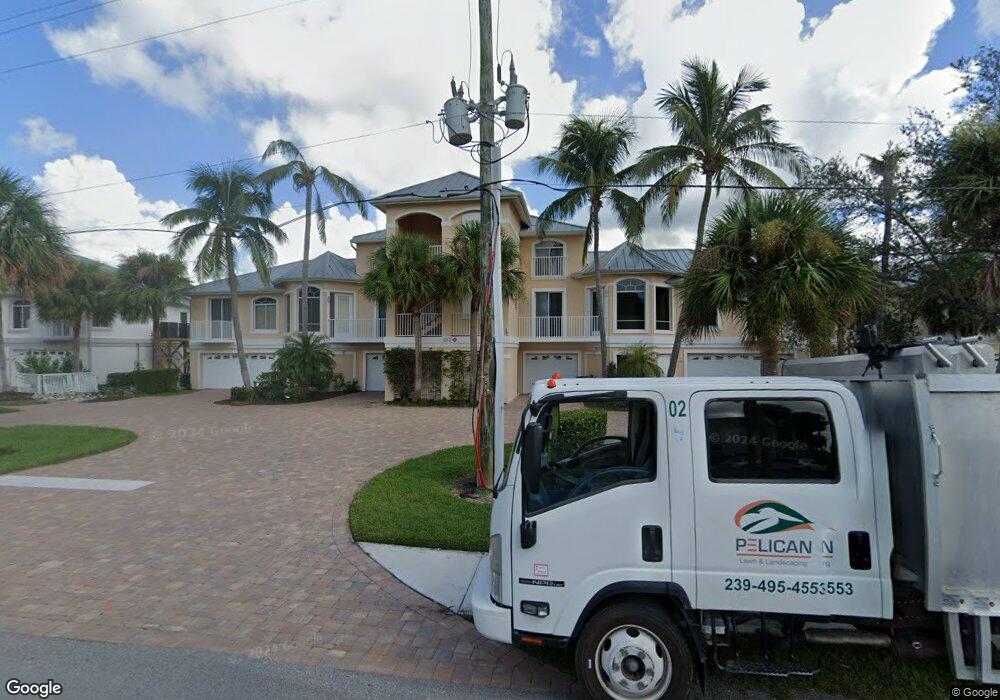
201 Lenell Rd Unit 4 Fort Myers Beach, FL 33931
Estimated Value: $646,000 - $795,000
3
Beds
2
Baths
3,384
Sq Ft
$212/Sq Ft
Est. Value
About This Home
This home is located at 201 Lenell Rd Unit 4, Fort Myers Beach, FL 33931 and is currently estimated at $718,231, approximately $212 per square foot. 201 Lenell Rd Unit 4 is a home located in Lee County with nearby schools including Fort Myers Beach Elementary School, Bonita Springs Middle Center for the Arts, and Cypress Lake Middle School.
Ownership History
Date
Name
Owned For
Owner Type
Purchase Details
Closed on
Mar 18, 2022
Sold by
Williams Craig P and Williams Georganne
Bought by
Mary Kristina Meyer Living Trust
Current Estimated Value
Home Financials for this Owner
Home Financials are based on the most recent Mortgage that was taken out on this home.
Original Mortgage
$581,250
Outstanding Balance
$537,137
Interest Rate
3%
Mortgage Type
Balloon
Estimated Equity
$181,094
Purchase Details
Closed on
Mar 9, 2020
Sold by
Fulton Carol and Fulton Warren
Bought by
Williams Craig P and Williams Georganne
Purchase Details
Closed on
Dec 19, 2005
Sold by
M I P Center Inc
Bought by
Fulton Warren and Fulton Carol
Purchase Details
Closed on
Aug 31, 1998
Sold by
Fulton Carol and Fulton Warren
Bought by
M I P Center Inc
Purchase Details
Closed on
Oct 17, 1997
Sold by
Lenell No 11 Ltd Ptnr
Bought by
Fulton Carol and Fulton Warren
Create a Home Valuation Report for This Property
The Home Valuation Report is an in-depth analysis detailing your home's value as well as a comparison with similar homes in the area
Home Values in the Area
Average Home Value in this Area
Purchase History
| Date | Buyer | Sale Price | Title Company |
|---|---|---|---|
| Mary Kristina Meyer Living Trust | $790,000 | Accent Title | |
| Williams Craig P | $524,000 | Accent Title Ins Agcy Inc | |
| Fulton Warren | -- | None Available | |
| M I P Center Inc | $282,500 | -- | |
| Fulton Carol | $282,500 | -- |
Source: Public Records
Mortgage History
| Date | Status | Borrower | Loan Amount |
|---|---|---|---|
| Open | Mary Kristina Meyer Living Trust | $581,250 |
Source: Public Records
Tax History Compared to Growth
Tax History
| Year | Tax Paid | Tax Assessment Tax Assessment Total Assessment is a certain percentage of the fair market value that is determined by local assessors to be the total taxable value of land and additions on the property. | Land | Improvement |
|---|---|---|---|---|
| 2025 | $6,941 | $417,639 | -- | $417,639 |
| 2024 | $1,276 | $494,037 | -- | $494,037 |
| 2023 | $1,276 | $70,499 | $0 | $70,499 |
| 2022 | $6,798 | $439,756 | $0 | $0 |
| 2021 | $5,990 | $399,778 | $0 | $399,778 |
| 2020 | $4,361 | $308,189 | $0 | $0 |
| 2019 | $4,276 | $301,260 | $0 | $0 |
| 2018 | $4,134 | $295,643 | $0 | $0 |
| 2017 | $4,120 | $289,562 | $0 | $0 |
| 2016 | $4,088 | $344,616 | $0 | $344,616 |
| 2015 | $4,129 | $296,600 | $0 | $296,600 |
| 2014 | -- | $279,400 | $0 | $279,400 |
| 2013 | -- | $386,600 | $0 | $386,600 |
Source: Public Records
Map
Nearby Homes
- 221 Lenell Rd Unit 5A
- 200 Lenell Rd Unit 214
- 200 Lenell Rd Unit 324
- 200 Lenell Rd Unit 215
- 271 Lenell Rd Unit 6D
- 170 Lenell Rd Unit 202
- 170 Lenell Rd Unit 501
- 170 Lenell Rd Unit 403
- 281 Lenell Rd Unit 1 (7-A)
- 150 Lenell Rd Unit 801
- 22628 Island Pines Way Unit 1302
- 22604 Island Pines Way Unit 2304
- 22652 Island Pines Way Unit 154
- 22652 Island Pines Way Unit 254
- 4431 Bay Beach Ln Unit 543
- 6891 Estero Blvd Unit 362
- 4341 Bay Beach Ln
- 4341 Bay Beach Ln Unit 644
- 4531 Bay Beach Ln Unit 333
- 4531 Bay Beach Ln Unit 334
- 201 Lenell Rd Unit 3D
- 201 Lenell Rd Unit 3C
- 201 Lenell Rd Unit 3B
- 201 Lenell Rd Unit 1
- 211 Lenell Rd Unit 4-A
- 211 Lenell Rd Unit 4
- 211 Lenell Rd
- 211 Lenell Rd
- 211 Lenell Rd Unit 4B
- 191 Lenell Rd Unit 1
- 191 Lenell Rd Unit 4D
- 191 Lenell Rd Unit 2A
- 191 Lenell Rd Unit 2C
- 191 Lenell Rd Unit 2B
- 191 Lenell Rd Unit 2D
- 191 Lenell Rd Unit 4
- 221 Lenell Rd Unit 5C
- 221 Lenell Rd Unit 5B
- 221 Lenell Rd Unit 5D
- 221 Lenell Rd Unit 2