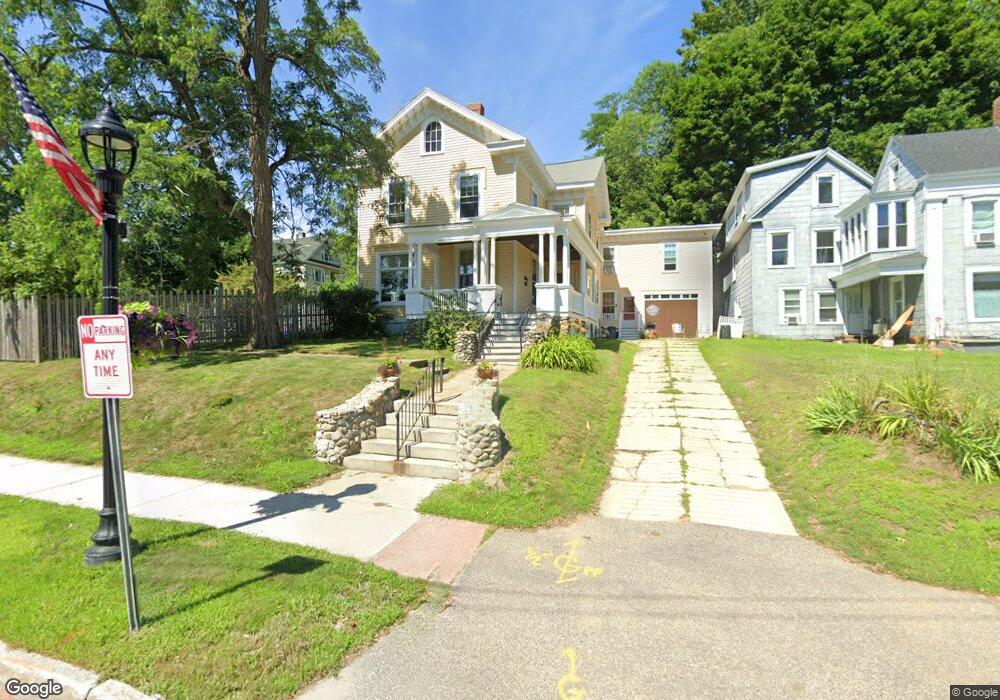
201 Main St Auburn, ME 04210
Estimated Value: $448,000 - $569,539
3
Beds
3
Baths
3,800
Sq Ft
$131/Sq Ft
Est. Value
About This Home
This home is located at 201 Main St, Auburn, ME 04210 and is currently estimated at $496,135, approximately $130 per square foot. 201 Main St is a home located in Androscoggin County with nearby schools including Sherwood Heights Elementary School, Auburn Middle School, and Edward Little High School.
Ownership History
Date
Name
Owned For
Owner Type
Purchase Details
Closed on
May 18, 2021
Sold by
Corner Pocket Prop Llc
Bought by
Phillips Harold and Vandermay Sharon
Current Estimated Value
Home Financials for this Owner
Home Financials are based on the most recent Mortgage that was taken out on this home.
Original Mortgage
$248,000
Outstanding Balance
$224,750
Interest Rate
3.1%
Mortgage Type
Purchase Money Mortgage
Estimated Equity
$271,385
Purchase Details
Closed on
Aug 28, 2018
Sold by
201 Main Street Realty
Bought by
Corner Pocket Properties
Home Financials for this Owner
Home Financials are based on the most recent Mortgage that was taken out on this home.
Original Mortgage
$157,500
Interest Rate
4.5%
Mortgage Type
New Conventional
Create a Home Valuation Report for This Property
The Home Valuation Report is an in-depth analysis detailing your home's value as well as a comparison with similar homes in the area
Home Values in the Area
Average Home Value in this Area
Purchase History
| Date | Buyer | Sale Price | Title Company |
|---|---|---|---|
| Phillips Harold | -- | None Available | |
| Corner Pocket Properties | -- | -- |
Source: Public Records
Mortgage History
| Date | Status | Borrower | Loan Amount |
|---|---|---|---|
| Open | Phillips Harold | $248,000 | |
| Previous Owner | Corner Pocket Properties | $157,500 |
Source: Public Records
Tax History Compared to Growth
Tax History
| Year | Tax Paid | Tax Assessment Tax Assessment Total Assessment is a certain percentage of the fair market value that is determined by local assessors to be the total taxable value of land and additions on the property. | Land | Improvement |
|---|---|---|---|---|
| 2024 | $9,352 | $420,300 | $58,400 | $361,900 |
| 2023 | $8,499 | $373,600 | $51,900 | $321,700 |
| 2022 | $6,511 | $286,200 | $69,000 | $217,200 |
| 2021 | $5,469 | $229,600 | $57,500 | $172,100 |
| 2020 | $5,453 | $229,600 | $57,500 | $172,100 |
| 2019 | $5,453 | $229,600 | $57,500 | $172,100 |
| 2018 | $5,437 | $229,600 | $57,500 | $172,100 |
| 2017 | $5,279 | $229,600 | $57,500 | $172,100 |
| 2016 | $5,132 | $229,600 | $57,500 | $172,100 |
| 2015 | $4,879 | $229,600 | $57,500 | $172,100 |
| 2013 | -- | $229,600 | $57,500 | $172,100 |
Source: Public Records
Map
Nearby Homes