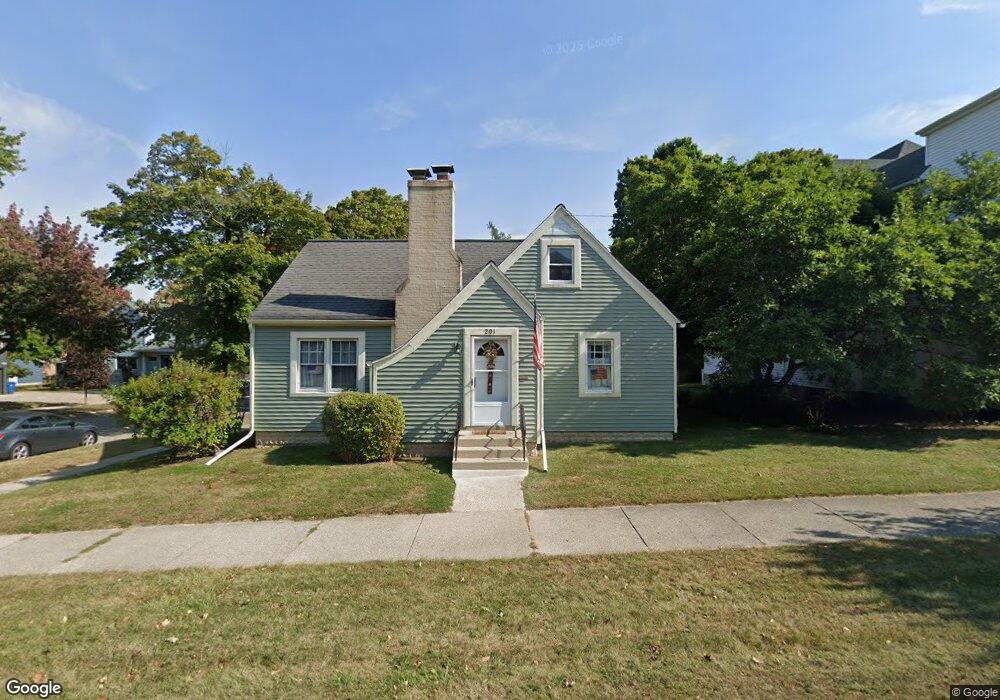
201 Maple St Manistee, MI 49660
Estimated Value: $202,566 - $247,000
3
Beds
2
Baths
1,901
Sq Ft
$119/Sq Ft
Est. Value
About This Home
This home is located at 201 Maple St, Manistee, MI 49660 and is currently estimated at $226,392, approximately $119 per square foot. 201 Maple St is a home located in Manistee County with nearby schools including John F. Kennedy Elementary School, Thomas Jefferson Elementary School, and Manistee Middle / High School.
Ownership History
Date
Name
Owned For
Owner Type
Purchase Details
Closed on
Jun 11, 2015
Sold by
Sambrook Lucille E
Bought by
Oliver Patricia
Current Estimated Value
Purchase Details
Closed on
Sep 28, 2012
Sold by
Africano Dana
Bought by
Oliver-Africano Patricia
Purchase Details
Closed on
Sep 8, 2012
Sold by
Africano Dana
Bought by
Oliver-Africano Patricia
Purchase Details
Closed on
Jul 29, 2011
Sold by
Sambrook Lucille E
Bought by
Africano Dana and Oliver-Africano Pat
Purchase Details
Closed on
Jun 30, 2009
Sold by
Riley Suzanne
Bought by
Sambrook Lucille E
Create a Home Valuation Report for This Property
The Home Valuation Report is an in-depth analysis detailing your home's value as well as a comparison with similar homes in the area
Home Values in the Area
Average Home Value in this Area
Purchase History
| Date | Buyer | Sale Price | Title Company |
|---|---|---|---|
| Oliver Patricia | $70,000 | -- | |
| Oliver-Africano Patricia | -- | -- | |
| Oliver-Africano Patricia | -- | -- | |
| Africano Dana | $70,000 | -- | |
| Sambrook Lucille E | $75,000 | -- |
Source: Public Records
Tax History
| Year | Tax Paid | Tax Assessment Tax Assessment Total Assessment is a certain percentage of the fair market value that is determined by local assessors to be the total taxable value of land and additions on the property. | Land | Improvement |
|---|---|---|---|---|
| 2025 | $1,302 | $80,400 | $0 | $0 |
| 2024 | $13 | $69,100 | $0 | $0 |
| 2023 | $1,225 | $63,700 | $0 | $0 |
| 2022 | $1,422 | $50,000 | $50,000 | $0 |
| 2021 | $1,387 | $44,100 | $44,100 | $0 |
| 2020 | $1,287 | $36,900 | $36,900 | $0 |
| 2019 | $1,274 | $30,700 | $30,700 | $0 |
| 2018 | $1,258 | $31,400 | $31,400 | $0 |
| 2017 | $1,232 | $30,300 | $30,300 | $0 |
| 2016 | $1,059 | $30,400 | $30,400 | $0 |
| 2015 | -- | $29,200 | $29,200 | $0 |
| 2014 | -- | $34,000 | $0 | $0 |
Source: Public Records
Map
Nearby Homes
Your Personal Tour Guide
Ask me questions while you tour the home.