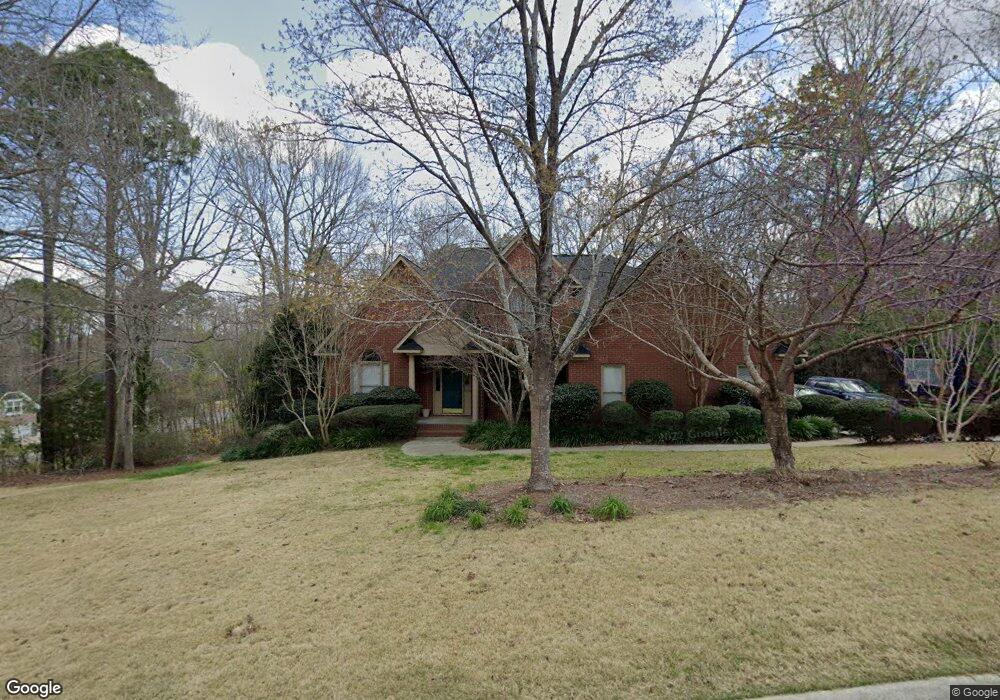
201 Misty Oaks Ct Lexington, SC 29072
Estimated Value: $546,000 - $692,315
5
Beds
5
Baths
3,643
Sq Ft
$168/Sq Ft
Est. Value
About This Home
This home is located at 201 Misty Oaks Ct, Lexington, SC 29072 and is currently estimated at $612,579, approximately $168 per square foot. 201 Misty Oaks Ct is a home located in Lexington County with nearby schools including Midway Elementary School, River Bluff High School, and Lake Murray Montessori School.
Ownership History
Date
Name
Owned For
Owner Type
Purchase Details
Closed on
Mar 31, 2022
Sold by
Raymond Fragola Jr
Bought by
Sullivan Mason and Sullivan Hillary M
Current Estimated Value
Home Financials for this Owner
Home Financials are based on the most recent Mortgage that was taken out on this home.
Original Mortgage
$397,500
Outstanding Balance
$374,989
Interest Rate
4.67%
Mortgage Type
New Conventional
Estimated Equity
$237,590
Purchase Details
Closed on
Jan 27, 2022
Sold by
Grunewald Mark S
Bought by
Fragola Raymond and Fragola Carine
Home Financials for this Owner
Home Financials are based on the most recent Mortgage that was taken out on this home.
Original Mortgage
$416,000
Interest Rate
3.45%
Mortgage Type
New Conventional
Purchase Details
Closed on
Oct 31, 2018
Sold by
Wyk Lyle E Van and Wyk Kay L Van
Bought by
Grunewald Mark S and Grunewald Nancy S
Purchase Details
Closed on
Apr 17, 2001
Sold by
Vanwyk Dennis A
Bought by
Vanwyk Lyle E
Purchase Details
Closed on
Apr 16, 2001
Sold by
Travelers Home Mtg Svcs In
Bought by
Malecki Mark K
Create a Home Valuation Report for This Property
The Home Valuation Report is an in-depth analysis detailing your home's value as well as a comparison with similar homes in the area
Home Values in the Area
Average Home Value in this Area
Purchase History
| Date | Buyer | Sale Price | Title Company |
|---|---|---|---|
| Sullivan Mason | $530,000 | None Listed On Document | |
| Fragola Raymond | $520,000 | None Listed On Document | |
| Grunewald Mark S | $388,000 | None Available | |
| Vanwyk Lyle E | $295,000 | -- | |
| Malecki Mark K | $37,400 | -- |
Source: Public Records
Mortgage History
| Date | Status | Borrower | Loan Amount |
|---|---|---|---|
| Open | Sullivan Mason | $397,500 | |
| Previous Owner | Fragola Raymond | $416,000 |
Source: Public Records
Tax History Compared to Growth
Tax History
| Year | Tax Paid | Tax Assessment Tax Assessment Total Assessment is a certain percentage of the fair market value that is determined by local assessors to be the total taxable value of land and additions on the property. | Land | Improvement |
|---|---|---|---|---|
| 2024 | $3,166 | $21,200 | $3,200 | $18,000 |
| 2023 | $3,166 | $15,520 | $3,200 | $12,320 |
| 2022 | $2,311 | $15,520 | $3,200 | $12,320 |
| 2020 | $2,370 | $15,520 | $3,200 | $12,320 |
| 2019 | $2,413 | $15,520 | $1,920 | $13,600 |
| 2018 | $2,069 | $13,563 | $1,920 | $11,643 |
| 2017 | $1,825 | $12,330 | $1,920 | $10,410 |
| 2016 | $1,808 | $12,329 | $1,920 | $10,409 |
| 2014 | $1,710 | $12,190 | $1,600 | $10,590 |
| 2013 | -- | $12,190 | $1,600 | $10,590 |
Source: Public Records
Map
Nearby Homes
- 240 Misty Oaks Ct
- 779 Hope Ferry Rd
- 382 Oliver Metz Rd
- 819 Hope Ferry Rd
- TBD Baron Rd
- 338 Andrew Corley Rd
- 363 Andrew Corley Rd
- 122 Lupine Ct
- 311 Andrew Corley Rd
- 140 Leonard Dr
- 516 Midway Forest Trail
- 310 Andrew Corley Rd
- 533 Midway Forest Trail
- 930 Corley Mill Rd
- 0 Bent Ridge Ct
- 306 Andrew Corley Rd
- 0 Center Dr Carolina Cr
- 261 Popes Ln
- 108 Sir Edwards Ln
- 247 Saxons Ferry Dr
- 207 Misty Oaks Ct
- 122 Misty Oaks Ct
- 106 Misty Oaks Place
- 204 Misty Oaks Ct
- 101 Misty Oaks Place
- 99 Misty Oaks Place
- 112 Misty Oaks Place
- 208 Misty Oaks Ct
- 107 Misty Oaks Place
- 211 Misty Oaks Ct
- 104 Oaks Ct
- 115 Misty Oaks Ct
- 107 Oaks Ct
- 113 Misty Oaks Place
- 118 Misty Oaks Place
- 212 Misty Oaks Ct
- 124 Misty Oaks Place
- 111 Oaks Ct
- 119 Misty Oaks Place
- 1223 Corley Mill Rd