201 Misty Way Grayling, MI 49738
Estimated Value: $157,830 - $220,000
About This Home
This home is located at 201 Misty Way, Grayling, MI 49738 and is currently estimated at $176,958, approximately $157 per square foot. 201 Misty Way is a home located in Crawford County with nearby schools including Grayling Elementary School, Grayling Middle School, and Grayling High School.
Ownership History
We collect this data history from publicly available records. To have your information removed, we recommend requesting removal directly through your county’s website.
Purchase Details
Purchase Details
Purchase Details
Purchase Details
Purchase Details
Purchase Details
Purchase Details
Purchase Details
Purchase Details
Purchase Details
Home Values in the Area
Average Home Value in this Area
Purchase History
We collect this data history from publicly available records. To have your information removed, we recommend requesting removal directly through your county’s website.
| Date | Buyer | Sale Price | Title Company |
|---|---|---|---|
| -- | None Available | ||
| -- | -- | ||
| $17,000 | -- | ||
| -- | -- | ||
| -- | -- | ||
| -- | -- | ||
| $79,000 | -- | ||
| -- | -- | ||
| $50,000 | -- | ||
| $50,000 | -- |
Tax History
We collect this data history from publicly available records. To have your information removed, we recommend requesting removal directly through your county’s website.
| Year | Tax Paid | Tax Assessment Tax Assessment Total Assessment is a certain percentage of the fair market value that is determined by local assessors to be the total taxable value of land and additions on the property. | Land | Improvement |
|---|---|---|---|---|
| 2026 | $1,346 | $68,000 | $5,000 | $63,000 |
| 2025 | $931 | $60,300 | $5,000 | $55,300 |
| 2024 | $913 | $51,600 | $5,000 | $46,600 |
| 2023 | $876 | $47,000 | $5,000 | $42,000 |
| 2022 | $831 | $42,200 | $5,000 | $37,200 |
| 2021 | $1,167 | $38,400 | $5,000 | $33,400 |
| 2020 | $1,154 | $38,200 | $5,000 | $33,200 |
| 2019 | $1,132 | $37,100 | $5,000 | $32,100 |
| 2018 | $1,112 | $36,500 | $5,000 | $31,500 |
| 2017 | $796 | $24,100 | $5,000 | $19,100 |
| 2016 | $789 | $21,000 | $21,000 | $0 |
| 2015 | $970 | $21,000 | $0 | $0 |
| 2014 | -- | $25,500 | $0 | $0 |
| 2013 | -- | $27,700 | $0 | $0 |
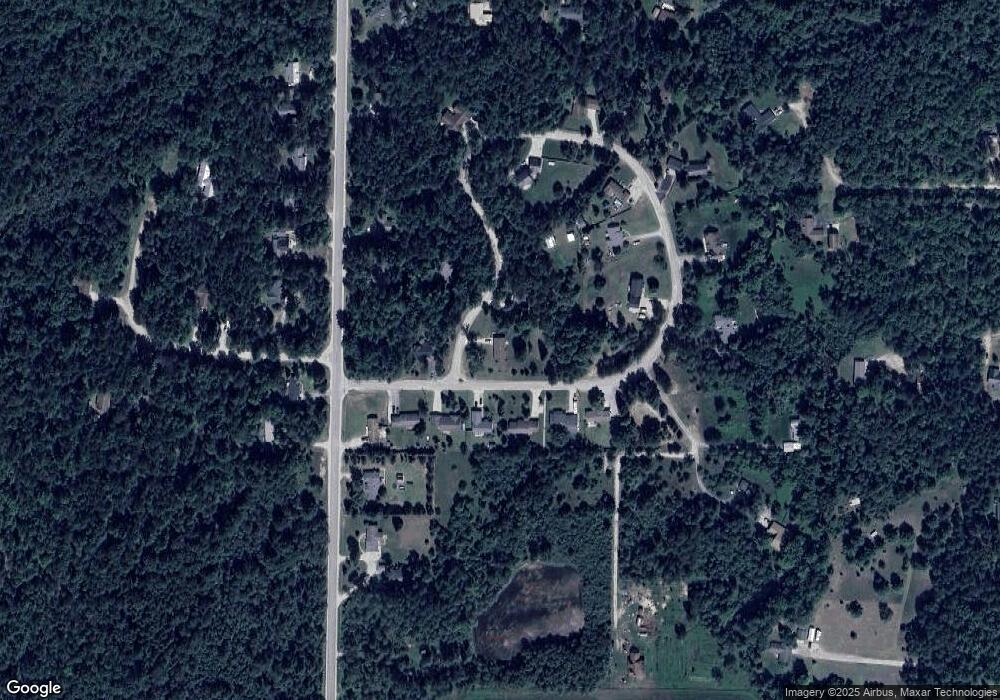
Map
- 0 Helen Unit 1943889
- 4871 Helen Dr
- Lot 31 Helen Dr
- 390 E Ember Trail
- Parcel A I-75 Business Loop
- 208 Crestwood Dr
- Parcel B I-75 Business Loop
- Parcel C I-75 Business Loop
- Lot 39 Northwood Dr
- Lot 27 Northwood Dr
- Lot 37 Northwood Dr
- Lot 29 Northwood Dr
- Lot 5 Northwood Dr
- Lot 2 Northwood Dr
- Lot 25 Northwood Dr
- Lot 20 Northwood Dr
- Lot 18 Northwood Dr
- Lot 12 Northwood Dr
- Lot 4 Northwood Dr
- Lot 30 Northwood Dr
- 201 Misty Way
- 245 Misty Way
- 103 Misty Way
- 200 Misty Way
- 202 Misty Way
- 0 Misty Way Unit 263482
- 0 Misty Way Unit 253357
- 0 Misty Way Unit LOT 10 267594
- 196 Misty Way
- 240 Misty Way
- 240 Misty Way
- 188 Misty Way
- 0 S Roberts Rd Unit 326477
- 0 S Roberts Rd Unit 78080022192
- 0 S Roberts Rd Unit Lot 18 & 1/2 of 19
- 107 S Roberts Rd
- 213 Misty Way
- 204 Misty Way
- 193 S Roberts Rd
- 10 Misty Way
Ask me questions while you tour the home.