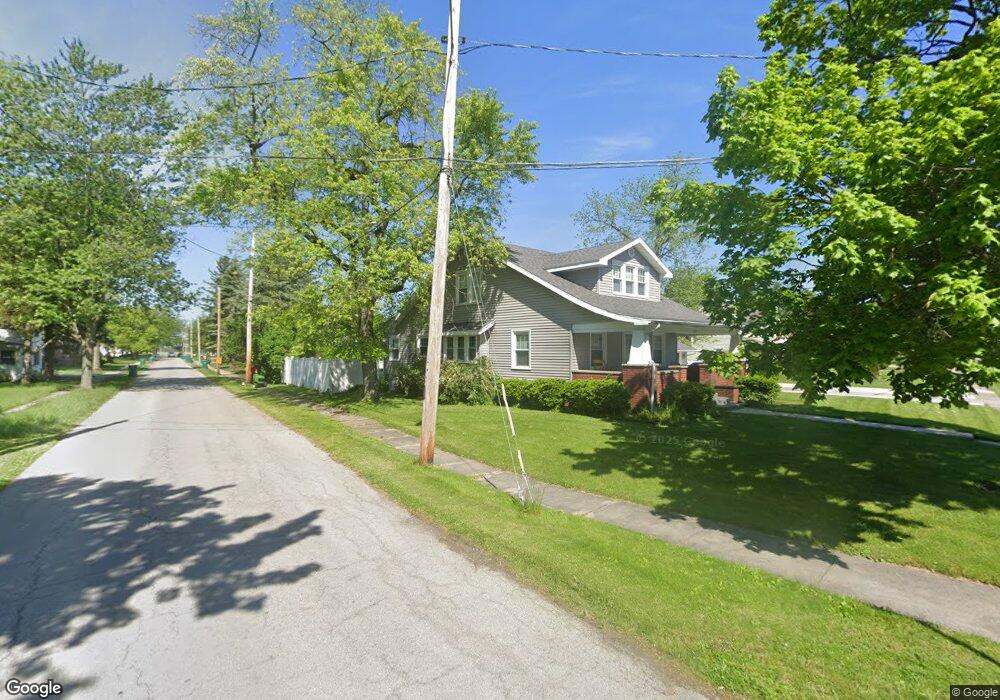
201 N Findlay Rd Haskins, OH 43525
Estimated Value: $234,000 - $293,000
3
Beds
2
Baths
1,398
Sq Ft
$182/Sq Ft
Est. Value
About This Home
This home is located at 201 N Findlay Rd, Haskins, OH 43525 and is currently estimated at $255,055, approximately $182 per square foot. 201 N Findlay Rd is a home located in Wood County with nearby schools including Otsego Elementary School, Otsego Junior High School, and Otsego High School.
Ownership History
Date
Name
Owned For
Owner Type
Purchase Details
Closed on
Jul 1, 2021
Sold by
Keller Robert D and Keller Suzanne M
Bought by
Billmaier Karen S
Current Estimated Value
Home Financials for this Owner
Home Financials are based on the most recent Mortgage that was taken out on this home.
Original Mortgage
$120,000
Outstanding Balance
$108,881
Interest Rate
2.9%
Mortgage Type
Future Advance Clause Open End Mortgage
Estimated Equity
$146,174
Purchase Details
Closed on
Jun 6, 2016
Sold by
Pierce Eric S and Pierce Molly K
Bought by
Keller Robert D and Keller Suzanne M
Home Financials for this Owner
Home Financials are based on the most recent Mortgage that was taken out on this home.
Original Mortgage
$102,760
Interest Rate
3.61%
Mortgage Type
New Conventional
Purchase Details
Closed on
Jun 5, 1985
Bought by
Pierce Steven C
Create a Home Valuation Report for This Property
The Home Valuation Report is an in-depth analysis detailing your home's value as well as a comparison with similar homes in the area
Home Values in the Area
Average Home Value in this Area
Purchase History
| Date | Buyer | Sale Price | Title Company |
|---|---|---|---|
| Billmaier Karen S | $210,000 | Mewhort Donald M | |
| Keller Robert D | $128,500 | None Available | |
| Pierce Steven C | $41,400 | -- |
Source: Public Records
Mortgage History
| Date | Status | Borrower | Loan Amount |
|---|---|---|---|
| Open | Billmaier Karen S | $120,000 | |
| Previous Owner | Keller Robert D | $102,760 |
Source: Public Records
Tax History Compared to Growth
Tax History
| Year | Tax Paid | Tax Assessment Tax Assessment Total Assessment is a certain percentage of the fair market value that is determined by local assessors to be the total taxable value of land and additions on the property. | Land | Improvement |
|---|---|---|---|---|
| 2024 | $2,940 | $64,120 | $8,050 | $56,070 |
| 2023 | $2,940 | $64,120 | $8,050 | $56,070 |
| 2022 | $2,157 | $42,420 | $7,140 | $35,280 |
| 2021 | $2,118 | $42,420 | $7,140 | $35,280 |
| 2020 | $2,128 | $42,420 | $7,140 | $35,280 |
| 2019 | $1,962 | $37,560 | $7,140 | $30,420 |
| 2018 | $1,955 | $37,560 | $7,140 | $30,420 |
| 2017 | $1,634 | $37,560 | $7,140 | $30,420 |
| 2016 | $1,367 | $27,720 | $7,070 | $20,650 |
| 2015 | $142 | $27,720 | $7,070 | $20,650 |
| 2014 | $1,408 | $27,720 | $7,070 | $20,650 |
| 2013 | $1,456 | $26,390 | $6,720 | $19,670 |
Source: Public Records
Map
Nearby Homes
- 0 River Rd W
- 117 S 5th St
- 22 S 5th St
- 0 W River Rd Unit 6133310
- 0 W River Rd Unit 6134934
- 131 N River Rd
- 16600 Tyler Rd
- 214 N 2nd St
- 132 Wilkshire Dr
- 341 N River Rd
- 842 Cherry Ln
- 305 Ridgepoint Cir
- 1371 Eastridge Dr
- 13124 Devils Hole Rd
- 0 King Rd Unit 10000333
- 491 Patriot Dr W
- 28 Mattatuck Way
- 540 Independence Dr
- 792 Wilkshire Dr
- 25216 John F McCarthy Way