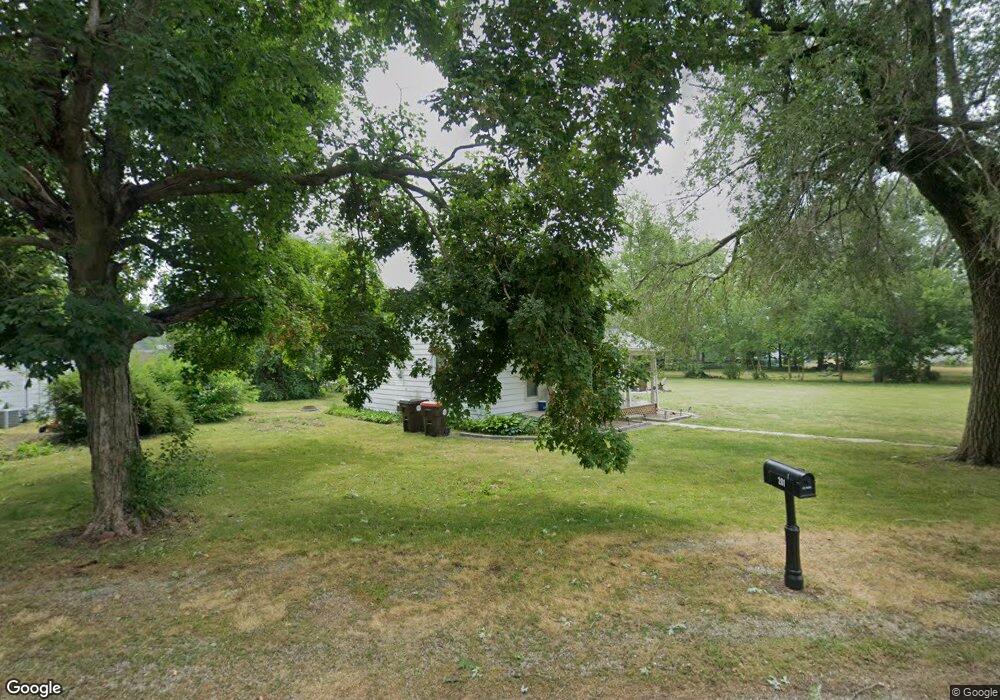
201 N Fisher St Mc Lean, IL 61754
Estimated Value: $72,000 - $120,000
--
Bed
2
Baths
814
Sq Ft
$128/Sq Ft
Est. Value
About This Home
This home is located at 201 N Fisher St, Mc Lean, IL 61754 and is currently estimated at $104,242, approximately $128 per square foot. 201 N Fisher St is a home located in McLean County with nearby schools including Olympia High School.
Ownership History
Date
Name
Owned For
Owner Type
Purchase Details
Closed on
Oct 9, 2020
Sold by
Mcternen Jessica D
Bought by
Mcternen Tyler E
Current Estimated Value
Home Financials for this Owner
Home Financials are based on the most recent Mortgage that was taken out on this home.
Original Mortgage
$58,200
Outstanding Balance
$30,647
Interest Rate
2.8%
Mortgage Type
New Conventional
Estimated Equity
$73,595
Purchase Details
Closed on
May 1, 2018
Sold by
Bryant Ronald E and Bryant Elaine
Bought by
Mcterner Tyler E and Mcterner Jessica D
Purchase Details
Closed on
Aug 18, 2007
Sold by
Bryant Connie S and Bryant Ronald E
Bought by
Bryant Ronald E and Bryant Elaine
Purchase Details
Closed on
Dec 11, 2006
Sold by
Coyle Gerald W and Coyle Bonnie Lou
Bought by
Bryant Ronald and Bryant Connie Sue
Purchase Details
Closed on
Dec 5, 2006
Sold by
Bryant Ronald and Bryant Connie Sue
Bought by
Bryant Ronald and Bryant Connie Sue
Create a Home Valuation Report for This Property
The Home Valuation Report is an in-depth analysis detailing your home's value as well as a comparison with similar homes in the area
Home Values in the Area
Average Home Value in this Area
Purchase History
| Date | Buyer | Sale Price | Title Company |
|---|---|---|---|
| Mcternen Tyler E | -- | Alliance Land Title | |
| Mcterner Tyler E | -- | Attorney | |
| Bryant Ronald E | $40,000 | Attorney | |
| Bryant Ronald E | -- | None Available | |
| Bryant Ronald | -- | None Available | |
| Bryan Ronald | -- | None Available | |
| Bryant Ronald | -- | None Available |
Source: Public Records
Mortgage History
| Date | Status | Borrower | Loan Amount |
|---|---|---|---|
| Open | Mcternen Tyler E | $58,200 | |
| Closed | Mcterner Tyler E | $0 |
Source: Public Records
Tax History Compared to Growth
Tax History
| Year | Tax Paid | Tax Assessment Tax Assessment Total Assessment is a certain percentage of the fair market value that is determined by local assessors to be the total taxable value of land and additions on the property. | Land | Improvement |
|---|---|---|---|---|
| 2024 | $1,982 | $24,834 | $15,305 | $9,529 |
| 2022 | $1,982 | $20,126 | $12,403 | $7,723 |
| 2021 | $1,867 | $18,953 | $11,680 | $7,273 |
| 2020 | $1,850 | $18,607 | $11,467 | $7,140 |
| 2019 | $1,839 | $18,607 | $11,467 | $7,140 |
| 2018 | $1,245 | $18,607 | $11,467 | $7,140 |
| 2017 | $1,253 | $18,607 | $11,467 | $7,140 |
| 2016 | $1,209 | $18,269 | $11,259 | $7,010 |
| 2015 | $1,146 | $17,687 | $10,900 | $6,787 |
| 2014 | $1,015 | $17,195 | $10,597 | $6,598 |
| 2013 | -- | $17,026 | $10,493 | $6,533 |
Source: Public Records
Map
Nearby Homes
- 2988 N 400 Rd E
- 180 N 400 East Rd
- 1517 W Lake Ct
- 46 N Lake Dr
- Lot 46 E Lake Ct
- 5 Sunnyside Estates
- 7 Sunnyside Estates
- 610 SE Vine St
- 2322 2000th St
- 307 N Vine St
- 8428 N Shirlane St
- 106 W Boundary St
- 305 W Boundary St
- 407 W Boundary St
- 405 W Carter St
- 18 Lincoln St
- 103 Wildflower Point
- 506 Prairie Meadows Dr
- 500 Prairie Meadows Dr
- 608 Prairie Meadows Dr