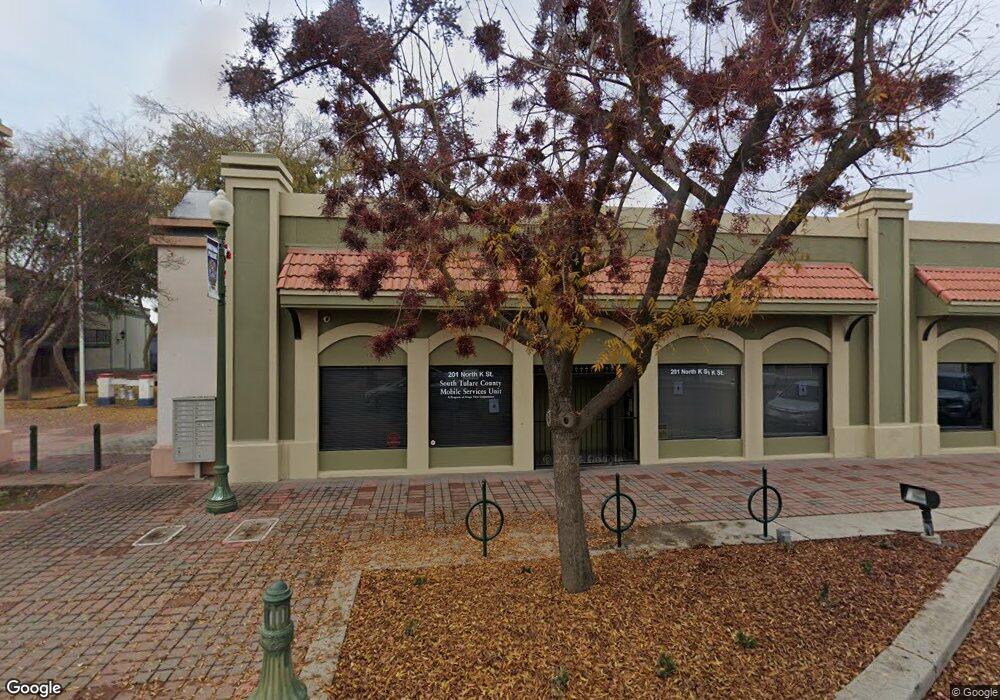
201 N K St Tulare, CA 93274
Estimated Value: $568,254
Studio
--
Bath
5,297
Sq Ft
$107/Sq Ft
Est. Value
About This Home
This home is located at 201 N K St, Tulare, CA 93274 and is currently estimated at $568,254, approximately $107 per square foot. 201 N K St is a home located in Tulare County with nearby schools including Wilson Elementary School, Cherry Avenue Middle School, and Tulare Union High School.
Ownership History
Date
Name
Owned For
Owner Type
Purchase Details
Closed on
Oct 16, 2020
Sold by
Wdb4 Llc
Bought by
Wilbourn Ronald L and Wilbourn Linda S
Current Estimated Value
Purchase Details
Closed on
Jun 12, 2018
Sold by
Wdb3 Llc
Bought by
Wdb4 Llc
Purchase Details
Closed on
Feb 12, 2018
Sold by
Banner Investments Llc
Bought by
Wdb3 Llc
Home Financials for this Owner
Home Financials are based on the most recent Mortgage that was taken out on this home.
Original Mortgage
$906,000
Interest Rate
4.15%
Mortgage Type
Commercial
Purchase Details
Closed on
Dec 2, 2016
Sold by
Blain Warren D
Bought by
Wdb3 Llc
Purchase Details
Closed on
May 3, 2007
Sold by
Brothers West Properties Llc
Bought by
Brothers West Properties Llc
Purchase Details
Closed on
Jul 29, 1999
Sold by
Despain Craig
Bought by
Despain Natalie
Create a Home Valuation Report for This Property
The Home Valuation Report is an in-depth analysis detailing your home's value as well as a comparison with similar homes in the area
Home Values in the Area
Average Home Value in this Area
Purchase History
We collect this data history from publicly available records. To have your information removed, we recommend requesting removal directly through your county’s website.
| Date | Buyer | Sale Price | Title Company |
|---|---|---|---|
| Wilbourn Ronald L | $415,000 | First American Title Company | |
| Wdb4 Llc | -- | None Available | |
| Wdb3 Llc | -- | Chicago Title Co | |
| Wdb3 Llc | -- | None Available | |
| Blain Warren D | $362,000 | None Available | |
| Brothers West Properties Llc | -- | None Available | |
| Despain Natalie | -- | Fidelity National Title Co |
Source: Public Records
Mortgage History
We collect this data history from publicly available records. To have your information removed, we recommend requesting removal directly through your county’s website.
| Date | Status | Borrower | Loan Amount |
|---|---|---|---|
| Previous Owner | Wdb3 Llc | $906,000 |
Source: Public Records
Tax History
| Year | Tax Paid | Tax Assessment Tax Assessment Total Assessment is a certain percentage of the fair market value that is determined by local assessors to be the total taxable value of land and additions on the property. | Land | Improvement |
|---|---|---|---|---|
| 2025 | $5,787 | $449,207 | $64,945 | $384,262 |
| 2024 | $5,736 | $440,400 | $63,672 | $376,728 |
| 2023 | $5,579 | $431,766 | $62,424 | $369,342 |
| 2022 | $5,408 | $423,300 | $61,200 | $362,100 |
| 2021 | $5,349 | $415,000 | $60,000 | $355,000 |
| 2020 | $7,140 | $562,440 | $53,060 | $509,380 |
| 2019 | $7,232 | $551,412 | $52,020 | $499,392 |
| 2018 | $7,195 | $540,600 | $51,000 | $489,600 |
| 2017 | $5,923 | $428,807 | $52,505 | $376,302 |
| 2016 | $5,698 | $420,399 | $51,475 | $368,924 |
| 2015 | $4,751 | $414,084 | $50,702 | $363,382 |
| 2014 | $4,751 | $405,973 | $49,709 | $356,264 |
Source: Public Records
Map
Nearby Homes
- 2838 Hidden Cove
- 220 S O St
- 348 N F St
- 560 N F St
- 815 E Sycamore Ave
- 605 N F St
- 551 Auburn St
- 316 S D St
- 554 S G St
- 733 - 735 W Tulare Ave
- 735 W Tulare Ave
- 630 Auburn St
- 517 S R St
- 933 E Cross Ave
- 311 S Pratt St
- 517 S S St
- 240 W Vetter
- 560 W Pleasant Ave Unit 16
- 560 W Pleasant Ave Unit 75
- 560 W Pleasant Ave Unit 26
Your Personal Tour Guide
Ask me questions while you tour the home.