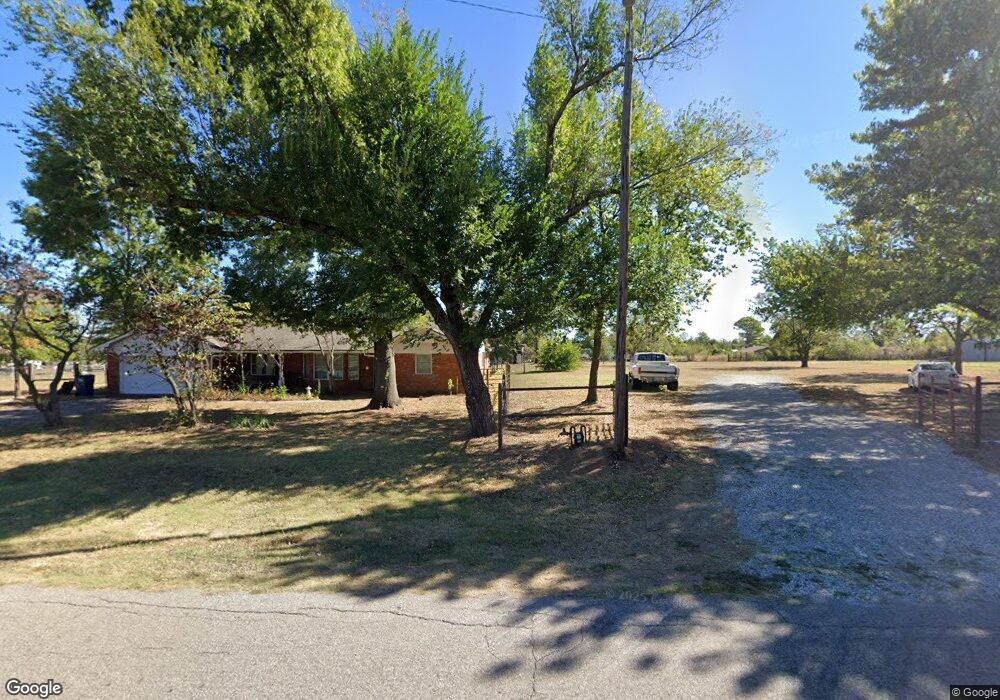
201 N Leo Ave Shawnee, OK 74801
Estimated Value: $185,000 - $242,319
3
Beds
2
Baths
2,280
Sq Ft
$92/Sq Ft
Est. Value
About This Home
This home is located at 201 N Leo Ave, Shawnee, OK 74801 and is currently estimated at $209,580, approximately $91 per square foot. 201 N Leo Ave is a home located in Pottawatomie County with nearby schools including Jefferson Elementary School, Shawnee Middle School, and Shawnee High School.
Ownership History
Date
Name
Owned For
Owner Type
Purchase Details
Closed on
Feb 28, 2025
Sold by
Barksdale Michael and Barksdale Cathy
Bought by
Christensen Desiree and Christensen Allen
Current Estimated Value
Home Financials for this Owner
Home Financials are based on the most recent Mortgage that was taken out on this home.
Original Mortgage
$140,000
Outstanding Balance
$138,944
Interest Rate
6.38%
Mortgage Type
New Conventional
Estimated Equity
$70,636
Purchase Details
Closed on
Nov 25, 2024
Sold by
Janie Kenneth V and Janie Newman
Bought by
Barksdale Michael and Barksdale Cathy
Purchase Details
Closed on
Nov 24, 1998
Sold by
Deloach Linda
Bought by
Marshall Kenneth and Marshall Janie
Purchase Details
Closed on
Aug 26, 1997
Sold by
Deloach Clois
Bought by
Deloach Linda
Purchase Details
Closed on
Feb 27, 1997
Sold by
Deloach Clois
Bought by
Deloach Linda
Create a Home Valuation Report for This Property
The Home Valuation Report is an in-depth analysis detailing your home's value as well as a comparison with similar homes in the area
Home Values in the Area
Average Home Value in this Area
Purchase History
| Date | Buyer | Sale Price | Title Company |
|---|---|---|---|
| Christensen Desiree | $189,500 | American Eagle | |
| Barksdale Michael | $215,000 | American Eagle | |
| Barksdale Michael | $215,000 | American Eagle | |
| Marshall Kenneth | $75,000 | -- | |
| Deloach Linda | -- | -- | |
| Deloach Linda | -- | -- |
Source: Public Records
Mortgage History
| Date | Status | Borrower | Loan Amount |
|---|---|---|---|
| Open | Christensen Desiree | $140,000 |
Source: Public Records
Tax History Compared to Growth
Tax History
| Year | Tax Paid | Tax Assessment Tax Assessment Total Assessment is a certain percentage of the fair market value that is determined by local assessors to be the total taxable value of land and additions on the property. | Land | Improvement |
|---|---|---|---|---|
| 2024 | -- | $13,584 | $1,576 | $12,008 |
| 2023 | -- | $13,584 | $1,576 | $12,008 |
| 2022 | $0 | $13,584 | $1,576 | $12,008 |
| 2021 | $0 | $13,584 | $1,576 | $12,008 |
| 2020 | $1,357 | $13,434 | $1,558 | $11,876 |
| 2019 | $1,336 | $12,795 | $1,451 | $11,344 |
| 2018 | $0 | $12,186 | $1,390 | $10,796 |
| 2017 | $0 | $11,605 | $1,006 | $10,599 |
| 2016 | $1,053 | $11,053 | $951 | $10,102 |
| 2015 | $1,053 | $10,527 | $837 | $9,690 |
| 2014 | $1,007 | $10,026 | $822 | $9,204 |
Source: Public Records
Map
Nearby Homes
- 302 S Leo Ave
- 300 S Kennedy Ave
- 000 W Locust St
- 1522 W Wheeler St
- 517 N Ione Ave
- 548 N Ione Ave
- 820 W Highland St
- 1108 W Dewey St
- 318 N Aydelotte Ave
- 321 S Aydelotte Ave
- 611 N Chapman Ave
- 607 W Dewey St
- 627 W Hayes St
- 548 N Kickapoo Ave
- 634 N Louisa Ave
- 521 S Louisa Ave
- 323 S Park Ave
- 810 N Kickapoo Ave
- 615 N Park Ave
- 426 N Beard Ave