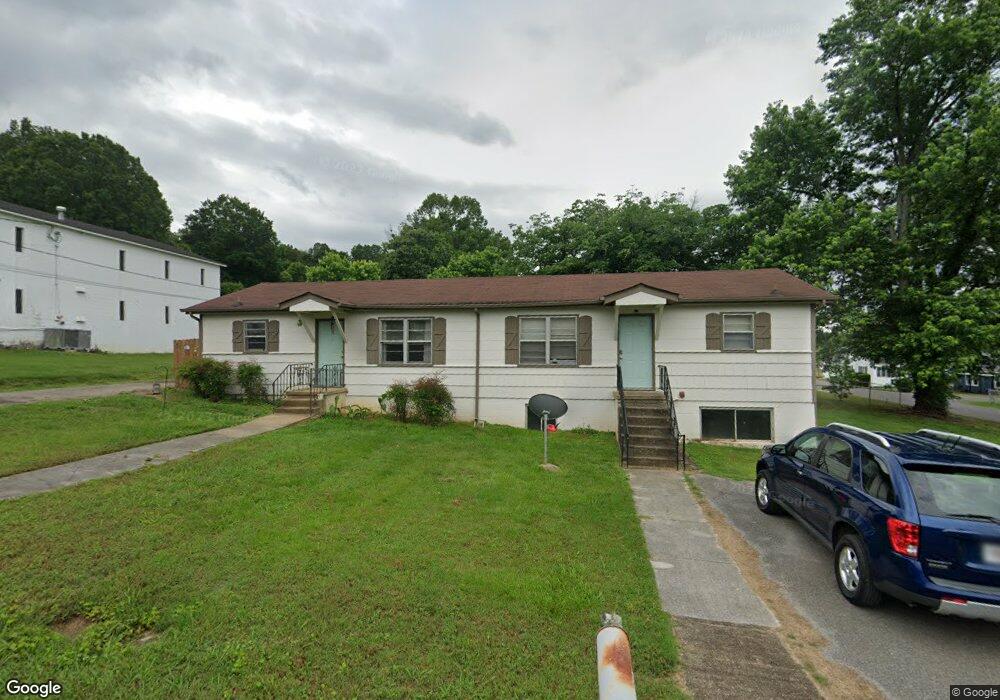
201 N Liner St Rossville, GA 30741
Estimated Value: $182,000 - $244,000
3
Beds
2
Baths
1,440
Sq Ft
$144/Sq Ft
Est. Value
About This Home
This home is located at 201 N Liner St, Rossville, GA 30741 and is currently estimated at $206,682, approximately $143 per square foot. 201 N Liner St is a home located in Walker County with nearby schools including Rossville Elementary School, Rossville Middle School, and Ridgeland High School.
Ownership History
Date
Name
Owned For
Owner Type
Purchase Details
Closed on
Apr 2, 2021
Sold by
Johnston Mack T
Bought by
Henry Joshua and Henry Kelly
Current Estimated Value
Home Financials for this Owner
Home Financials are based on the most recent Mortgage that was taken out on this home.
Original Mortgage
$113,460
Outstanding Balance
$102,441
Interest Rate
3%
Mortgage Type
Commercial
Estimated Equity
$104,241
Purchase Details
Closed on
Jan 16, 2004
Sold by
Hicks Roy and Hicks Joan C
Bought by
Johnston Mack T and Johnston Ann
Purchase Details
Closed on
Jul 9, 2003
Sold by
Dempsey Robert
Bought by
Hicks Roy and Hicks Joan C
Purchase Details
Closed on
Jun 7, 1996
Sold by
Ellis Bryan J Paul D and Ellis David
Bought by
Dempsey Robert
Purchase Details
Closed on
Jan 3, 1995
Sold by
Hood Sandra D and Hood Audrey D
Bought by
Ellis Bryan J Paul D and Ellis David
Purchase Details
Closed on
Jan 1, 1972
Bought by
Ellis John Dr
Purchase Details
Closed on
Sep 16, 1971
Sold by
Ellis John Dr
Bought by
Hood Sandra D and Hood Audrey D
Create a Home Valuation Report for This Property
The Home Valuation Report is an in-depth analysis detailing your home's value as well as a comparison with similar homes in the area
Home Values in the Area
Average Home Value in this Area
Purchase History
| Date | Buyer | Sale Price | Title Company |
|---|---|---|---|
| Henry Joshua | $130,000 | -- | |
| Johnston Mack T | $68,500 | -- | |
| Hicks Roy | $50,000 | -- | |
| Dempsey Robert | $30,500 | -- | |
| Ellis Bryan J Paul D | -- | -- | |
| Ellis John Dr | -- | -- | |
| Hood Sandra D | -- | -- |
Source: Public Records
Mortgage History
| Date | Status | Borrower | Loan Amount |
|---|---|---|---|
| Open | Henry Joshua | $113,460 |
Source: Public Records
Tax History Compared to Growth
Tax History
| Year | Tax Paid | Tax Assessment Tax Assessment Total Assessment is a certain percentage of the fair market value that is determined by local assessors to be the total taxable value of land and additions on the property. | Land | Improvement |
|---|---|---|---|---|
| 2024 | $2,220 | $67,995 | $4,672 | $63,323 |
| 2023 | $2,129 | $64,499 | $4,672 | $59,827 |
| 2022 | $1,369 | $54,764 | $3,114 | $51,650 |
| 2021 | $954 | $32,480 | $3,114 | $29,366 |
| 2020 | $815 | $26,576 | $3,114 | $23,462 |
| 2019 | $816 | $26,576 | $3,114 | $23,462 |
| 2018 | $791 | $26,576 | $3,114 | $23,462 |
| 2017 | $884 | $26,576 | $3,114 | $23,462 |
| 2016 | $733 | $26,576 | $3,114 | $23,462 |
| 2015 | $846 | $29,244 | $3,136 | $26,108 |
| 2014 | $815 | $29,244 | $3,136 | $26,108 |
| 2013 | -- | $29,244 | $3,136 | $26,108 |
Source: Public Records
Map
Nearby Homes
- 0 Dempsey Ln Unit 1504691
- 301 Dempsey Ln
- 115 Beech St
- 39 Clift Trail
- 0 S Mission Ridge Dr Unit 1504695
- 189 Leinbach Rd
- 806 Mcfarland Ave
- 141 Hogan Rd
- 71 Georgia Terrace
- 3312 E 51st St
- 0 Clift Trail Unit 1502212
- 302 E Gordon Ave
- 1515 E 50th St
- 4908 13th Ave
- 127 Summitt St
- 200 W Oak St
- 916 Logan Ave
- 4900 15th Ave
- 4807 14th Ave
- 0 Summit St Unit 1514634
- N Liner St
- 405 Andrews St
- 406 Andrews St
- 400 Andrews St
- 307 Andrews St
- 407 Andrews St
- 114 N Liner St
- 200 N Liner St
- 0 Andrews St
- 215 Bryan St
- 112 N Liner St
- 213 Bryan St
- 403 Missionary Ave
- 110 N Liner St
- 1 Dempsey Ln
- 405 A&b Missi0nary Ave
- 400 Missionary Ave
- 310 Missionary Ave
- 211 Bryan St
- 309 Missionary Ave