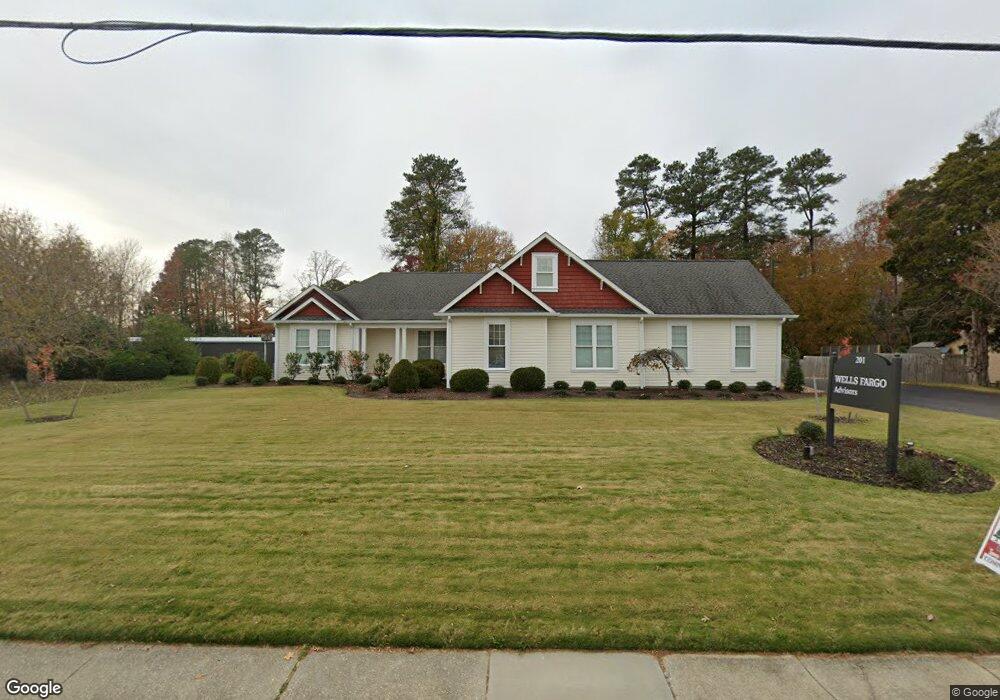
201 N Main St Kilmarnock, VA 22482
Estimated Value: $556,632
4
Beds
2
Baths
1,916
Sq Ft
$291/Sq Ft
Est. Value
About This Home
This home is located at 201 N Main St, Kilmarnock, VA 22482 and is currently estimated at $556,632, approximately $290 per square foot. 201 N Main St is a home located in Lancaster County with nearby schools including Lancaster Primary School, Lancaster Middle School, and Lancaster High School.
Ownership History
Date
Name
Owned For
Owner Type
Purchase Details
Closed on
Jun 19, 2020
Sold by
Dilday E Lloyd E and Dilday Jennifer L
Bought by
Blue Barn Properties Llc
Current Estimated Value
Home Financials for this Owner
Home Financials are based on the most recent Mortgage that was taken out on this home.
Original Mortgage
$304,000
Outstanding Balance
$269,473
Interest Rate
3.2%
Mortgage Type
Commercial
Estimated Equity
$287,159
Purchase Details
Closed on
Apr 3, 2013
Sold by
Wells Fargo Bank Na
Bought by
Dilday Lloyd
Purchase Details
Closed on
Sep 21, 2012
Sold by
Prof Foreclosure Corp Of Va T and Caster Allen W
Bought by
Wells Fargo Bank Na
Create a Home Valuation Report for This Property
The Home Valuation Report is an in-depth analysis detailing your home's value as well as a comparison with similar homes in the area
Home Values in the Area
Average Home Value in this Area
Purchase History
| Date | Buyer | Sale Price | Title Company |
|---|---|---|---|
| Blue Barn Properties Llc | $380,000 | Attorney | |
| Dilday Lloyd | $57,799 | -- | |
| Wells Fargo Bank Na | $154,000 | -- |
Source: Public Records
Mortgage History
| Date | Status | Borrower | Loan Amount |
|---|---|---|---|
| Open | Blue Barn Properties Llc | $304,000 |
Source: Public Records
Tax History Compared to Growth
Tax History
| Year | Tax Paid | Tax Assessment Tax Assessment Total Assessment is a certain percentage of the fair market value that is determined by local assessors to be the total taxable value of land and additions on the property. | Land | Improvement |
|---|---|---|---|---|
| 2024 | $2,604 | $473,400 | $183,000 | $290,400 |
| 2023 | $2,630 | $417,400 | $156,800 | $260,600 |
| 2022 | $2,630 | $417,400 | $156,800 | $260,600 |
| 2021 | $2,630 | $417,400 | $156,800 | $260,600 |
| 2020 | $2,630 | $417,400 | $156,800 | $260,600 |
| 2019 | $3,533 | $560,800 | $156,800 | $404,000 |
| 2018 | $2,826 | $479,000 | $104,500 | $374,500 |
| 2017 | $2,826 | $479,000 | $104,500 | $374,500 |
| 2016 | -- | $479,000 | $104,500 | $374,500 |
| 2014 | -- | $0 | $0 | $0 |
| 2013 | -- | $0 | $0 | $0 |
Source: Public Records
Map
Nearby Homes