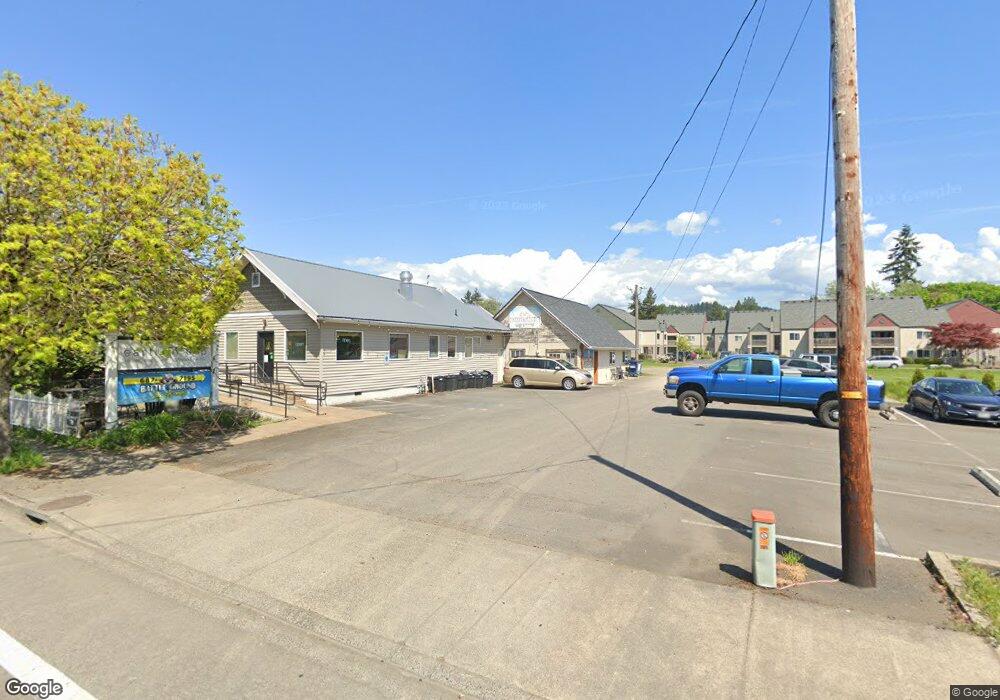
201 N Parkway Ave Battle Ground, WA 98604
4
Beds
--
Bath
1,822
Sq Ft
0.27
Acres
About This Home
This home is located at 201 N Parkway Ave, Battle Ground, WA 98604. 201 N Parkway Ave is a home located in Clark County with nearby schools including Captain Strong Primary School, Chief Umtuch Middle School, and Battle Ground High School.
Ownership History
Date
Name
Owned For
Owner Type
Purchase Details
Closed on
Sep 21, 2009
Sold by
Opdhal Thomas J and Opdahl Gerald J
Bought by
Tom & Gerald Llc
Purchase Details
Closed on
Jan 8, 2009
Sold by
Opdahl Thomas J
Bought by
Opdahl Thomas J and Opdahl Gerald J
Purchase Details
Closed on
Aug 9, 2005
Sold by
Tharp Craig E and Tharp Cynthia C
Bought by
Opdahl Thomas
Home Financials for this Owner
Home Financials are based on the most recent Mortgage that was taken out on this home.
Original Mortgage
$128,000
Interest Rate
5.64%
Mortgage Type
Commercial
Purchase Details
Closed on
Aug 26, 2002
Sold by
Tharp Craig E and Tharp Cynthia C
Bought by
Opdahl Thomas J and Opdahl Kristan M
Purchase Details
Closed on
Oct 13, 1995
Sold by
Schmid Anthony J and Schmid Sandra L
Bought by
Tharp Craig E and Tharp Cynthia C
Home Financials for this Owner
Home Financials are based on the most recent Mortgage that was taken out on this home.
Original Mortgage
$63,000
Interest Rate
7.8%
Mortgage Type
Commercial
Create a Home Valuation Report for This Property
The Home Valuation Report is an in-depth analysis detailing your home's value as well as a comparison with similar homes in the area
Home Values in the Area
Average Home Value in this Area
Purchase History
| Date | Buyer | Sale Price | Title Company |
|---|---|---|---|
| Tom & Gerald Llc | -- | None Available | |
| Opdahl Thomas J | -- | None Available | |
| Opdahl Thomas | -- | Cascade Title | |
| Opdahl Thomas J | $130,000 | Fidelity National Title | |
| Tharp Craig E | $21,723 | First American Title Co |
Source: Public Records
Mortgage History
| Date | Status | Borrower | Loan Amount |
|---|---|---|---|
| Previous Owner | Opdahl Thomas | $128,000 | |
| Previous Owner | Tharp Craig E | $63,000 |
Source: Public Records
Tax History Compared to Growth
Tax History
| Year | Tax Paid | Tax Assessment Tax Assessment Total Assessment is a certain percentage of the fair market value that is determined by local assessors to be the total taxable value of land and additions on the property. | Land | Improvement |
|---|---|---|---|---|
| 2025 | $2,608 | $319,500 | $186,900 | $132,600 |
| 2024 | $2,205 | $319,500 | $186,900 | $132,600 |
| 2023 | $2,197 | $279,000 | $161,920 | $117,080 |
| 2022 | $2,297 | $279,000 | $161,920 | $117,080 |
| 2021 | $2,503 | $253,600 | $147,200 | $106,400 |
| 2020 | $2,209 | $253,600 | $147,200 | $106,400 |
| 2019 | $1,887 | $253,600 | $142,695 | $110,905 |
| 2018 | $2,446 | $253,600 | $0 | $0 |
| 2017 | $2,246 | $241,500 | $0 | $0 |
| 2016 | $1,982 | $241,500 | $0 | $0 |
| 2015 | $2,088 | $195,500 | $0 | $0 |
| 2014 | -- | $195,500 | $0 | $0 |
| 2013 | -- | $195,500 | $0 | $0 |
Source: Public Records
Map
Nearby Homes
- 213 SE 1st Ave
- 408 S Parkway Ave
- 532 SW 23rd St
- 526 SW 23rd St
- 902 N Parkway Ave
- 407 SW 32nd St
- 711 NE 6th St
- 907 NE 1st Ave
- 709 NW 6th Ave
- 722 NE 4th Way
- 506 SE 5th St
- 12 SE 9th Cir
- 3107 SW 4th Ave
- 3111 SW 4th Ave
- 1306 NE 8th Ave
- 1350 NE 8th Ave
- 1334 NE 8th Ave
- 1328 NE 8th Ave
- 1342 NE 8th Ave
- 710 SE 5th Way Unit E13
- 205 N Parkway Ave
- 103 N Parkway Ave
- 311 N Parkway Ave
- 315 N Parkway Ave
- 308 NE 1st Ave Unit 101
- 308 NE 1st Ave
- 310 NE 1st Ave Unit 101
- 310 NE 1st Ave
- 15 NE 4th St
- 101 NE 1st St
- 319 N Parkway Ave
- 312 NE 1st Ave Unit 101
- 314 NE 1st Ave Unit 101
- 314 NE 1st Ave
- 0 NE 4th St
- 14 E Main St
- 202 NE 1st St
- 407 N Parkway Ave
- 0 SE 1st Ave
- 1437 SE 1st Ave