
Seller's Agent in 2026
April Herbel
Herbel Real Estate LLC
(580) 522-1163
57 Total Sales
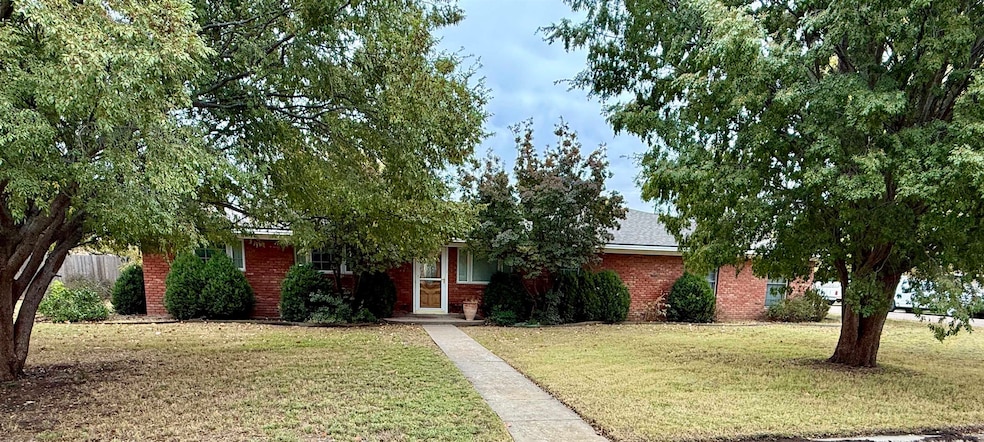
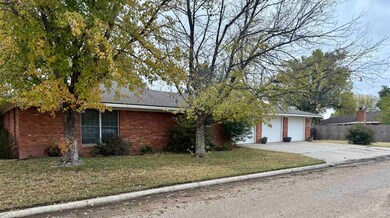
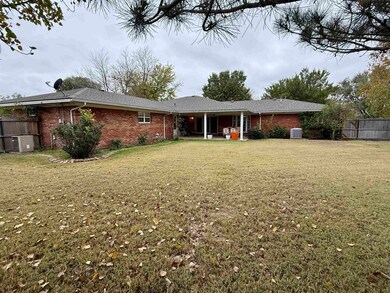
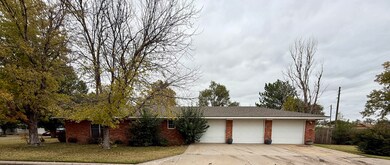
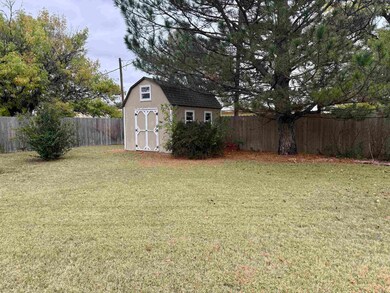
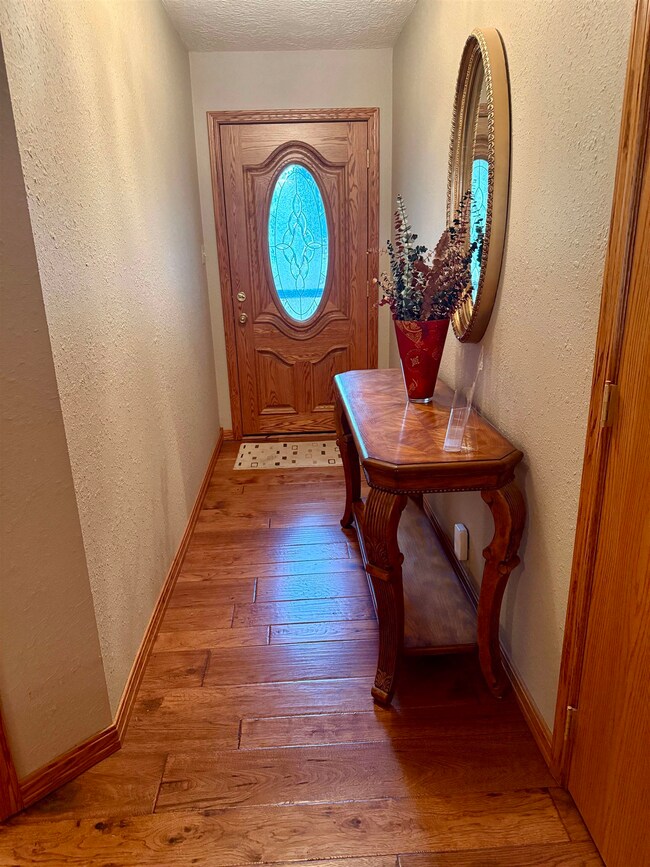
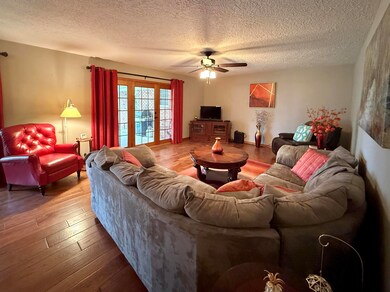
Beautiful fully remodeled 4 bedroom, 2.5 bath home located just south of the golf course on two corner lots. The bathrooms and kitchen have granite counter tops and tile flooring with luxurious dark mahogany hand scraped floors throughout the rest of the home. The spacious primary bedroom has a double walk in closet then wraps to an ensuite primary bath with jacuzzi tub, walk in shower, large double vanity area with built in storage space galore. The utility room includes a sink and office space with a built in desk, counter and top to bottom storage cabinets. The attached 3 car garage includes built in shelving and work bench which leads to a covered patio and double fenced lot with a nice sized garden shed. The home includes two HVAC systems, in home water treatment system, whole house humidifier, newer windows with blind inserts and an inground sprinkler system to water the well kept lawn. This is A Rare GEM in Hooker, OK.
Last Agent to Sell the Property
Herbel Real Estate LLC License #177913 Listed on: 10/26/2025
| Date | Type | Sale Price | Title Company |
|---|---|---|---|
| Warranty Deed | -- | -- | |
| Warranty Deed | -- | -- |
| Date | Event | Price | List to Sale | Price per Sq Ft |
|---|---|---|---|---|
| 01/09/2026 01/09/26 | Sold | $275,000 | 0.0% | $140 / Sq Ft |
| 10/26/2025 10/26/25 | Pending | -- | -- | -- |
| 10/26/2025 10/26/25 | For Sale | $275,000 | -- | $140 / Sq Ft |
| Year | Tax Paid | Tax Assessment Tax Assessment Total Assessment is a certain percentage of the fair market value that is determined by local assessors to be the total taxable value of land and additions on the property. | Land | Improvement |
|---|---|---|---|---|
| 2025 | $695 | $13,123 | $1,997 | $11,126 |
| 2024 | $595 | $12,370 | $1,882 | $10,488 |
| 2023 | $595 | $12,370 | $2,262 | $10,108 |
| 2022 | $700 | $12,370 | $814 | $11,556 |
| 2021 | $679 | $12,370 | $814 | $11,556 |
| 2020 | $657 | $11,660 | $500 | $11,160 |
| 2019 | $646 | $11,320 | $500 | $10,820 |
| 2018 | $627 | $10,991 | $500 | $10,491 |
| 2017 | $555 | $10,671 | $500 | $10,171 |
| 2016 | $520 | $10,360 | $500 | $9,860 |
| 2015 | -- | $10,360 | $500 | $9,860 |
| 2014 | -- | $10,360 | $500 | $9,860 |
Seller's Agent in 2026
April Herbel
Herbel Real Estate LLC
(580) 522-1163
57 Total Sales
Source: Northwest Oklahoma Association of REALTORS®
MLS Number: 20251488
APN: 700007183
Disclaimer: Certain information contained herein is derived from information provided by parties other than Homes.com. All information provided is deemed reliable, but is not guaranteed to be accurate and should be independently verified.
![]() IDX information is provided exclusively for personal, non-commercial use, and may not be used for any purpose other than to identify prospective properties consumers may be interested in purchasing. Information is deemed reliable but not guaranteed.
IDX information is provided exclusively for personal, non-commercial use, and may not be used for any purpose other than to identify prospective properties consumers may be interested in purchasing. Information is deemed reliable but not guaranteed.
Ask me questions while you tour the home.