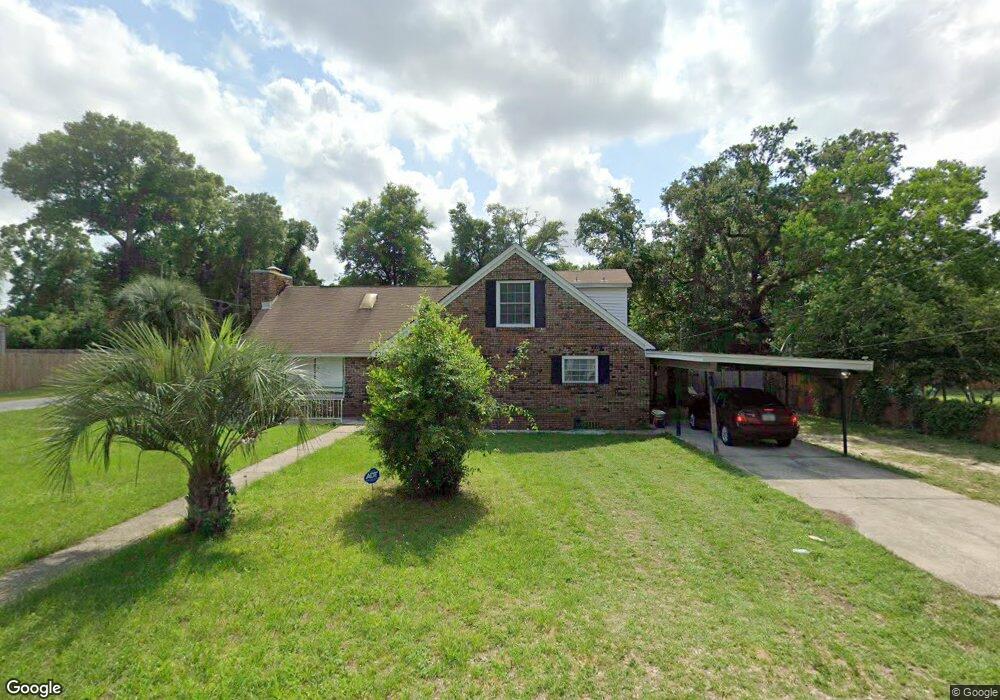
201 N Pinewood Ln Pensacola, FL 32507
Estimated Value: $139,000 - $256,000
--
Bed
2
Baths
1,855
Sq Ft
$107/Sq Ft
Est. Value
About This Home
This home is located at 201 N Pinewood Ln, Pensacola, FL 32507 and is currently estimated at $197,798, approximately $106 per square foot. 201 N Pinewood Ln is a home located in Escambia County with nearby schools including West Pensacola Elementary School, Warrington Middle School, and Pensacola High School.
Ownership History
Date
Name
Owned For
Owner Type
Purchase Details
Closed on
Apr 7, 2014
Sold by
Kendrick Karen D
Bought by
Weeks Samuel E and Weekes Samuel E
Current Estimated Value
Home Financials for this Owner
Home Financials are based on the most recent Mortgage that was taken out on this home.
Original Mortgage
$42,000
Outstanding Balance
$12,656
Interest Rate
4.37%
Mortgage Type
Purchase Money Mortgage
Estimated Equity
$185,142
Purchase Details
Closed on
Mar 4, 2005
Sold by
Smith Denise W
Bought by
Kendrick Karen D and Weeks Samuel E
Home Financials for this Owner
Home Financials are based on the most recent Mortgage that was taken out on this home.
Original Mortgage
$70,800
Interest Rate
5.6%
Mortgage Type
Purchase Money Mortgage
Purchase Details
Closed on
Jul 23, 1997
Sold by
Hollinger Brenton J and Hollinger Delois A
Bought by
Smith Denise W
Home Financials for this Owner
Home Financials are based on the most recent Mortgage that was taken out on this home.
Original Mortgage
$242
Interest Rate
6.87%
Mortgage Type
FHA
Create a Home Valuation Report for This Property
The Home Valuation Report is an in-depth analysis detailing your home's value as well as a comparison with similar homes in the area
Home Values in the Area
Average Home Value in this Area
Purchase History
| Date | Buyer | Sale Price | Title Company |
|---|---|---|---|
| Weeks Samuel E | -- | None Available | |
| Kendrick Karen D | $70,800 | Title Offices Llc | |
| Smith Denise W | $69,900 | -- |
Source: Public Records
Mortgage History
| Date | Status | Borrower | Loan Amount |
|---|---|---|---|
| Open | Weeks Samuel E | $42,000 | |
| Previous Owner | Kendrick Karen D | $70,800 | |
| Previous Owner | Smith Denise W | $242 |
Source: Public Records
Tax History Compared to Growth
Tax History
| Year | Tax Paid | Tax Assessment Tax Assessment Total Assessment is a certain percentage of the fair market value that is determined by local assessors to be the total taxable value of land and additions on the property. | Land | Improvement |
|---|---|---|---|---|
| 2024 | $1,869 | $149,385 | $12,736 | $136,649 |
| 2023 | $1,869 | $124,719 | $0 | $0 |
| 2022 | $1,739 | $131,288 | $10,189 | $121,099 |
| 2021 | $1,567 | $105,534 | $0 | $0 |
| 2020 | $1,402 | $93,704 | $0 | $0 |
| 2019 | $1,337 | $88,207 | $0 | $0 |
| 2018 | $1,284 | $82,639 | $0 | $0 |
| 2017 | $1,264 | $79,476 | $0 | $0 |
| 2016 | $1,252 | $77,289 | $0 | $0 |
| 2015 | $1,191 | $73,645 | $0 | $0 |
| 2014 | $1,138 | $70,100 | $0 | $0 |
Source: Public Records
Map
Nearby Homes
- 204 Freedom Ln
- 201 S Stillman St Unit 103
- 201 S Stillman St Unit 107
- 201 S Stillman St Unit 304
- 301 N Stillman St
- 195 Harrison Ave
- 212 Shadow Lawn Ln
- 204 Chaseville St
- 3315 Marques St
- 202 Edgewater Dr
- 301 Chaseville St
- 206 Ehrmann St
- 4100 W Belmont St
- 3290 Bayou Dr
- 3707 W Jackson St
- 3715 W Jackson St
- 3705 & 3709 W Jackson St
- 3235 Bayou Dr
- 321 Chaseville St
- 320 Chaseville St
- 205 N Pinewood Ln
- N N Pinewood Ln Unit B
- N N Pinewood Ln
- 0 N Pinewood Ln
- 212 N Pinewood Ln
- 204 N Pinewood Ln
- 108 Shadow Lawn Ln
- 107 Pinewood Dr
- 210 N Pinewood Ln
- 101 Freedom Ln
- 105 Freedom Ln Unit 2
- 105 Freedom Ln
- 106 N Pinewood Ln
- 108 N Pinewood Ln
- 208 N Pinewood Ln
- 112 Shadow Lawn Ln
- 109 Shadow Lawn Ln
- 3704 W Navy Blvd
- 220 N Pinewood Ln
- 111 Freedom Ln