
Seller's Agent in 2016
John Dye
Strong Real Estate Solutions
(419) 630-6453
64 in this area
100 Total Sales
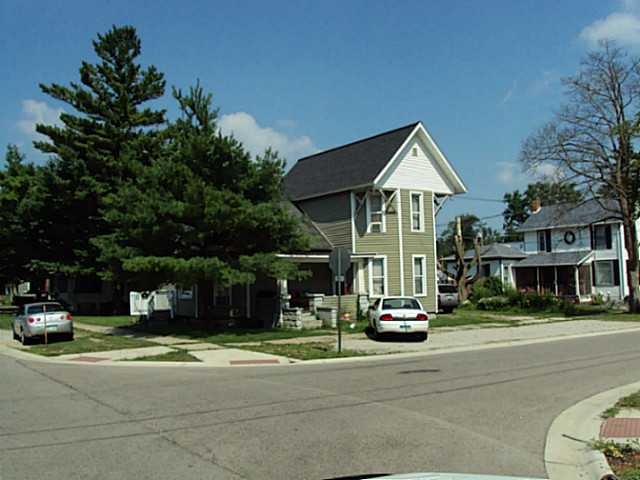
Estimated Value: $76,875 - $135,000
Good income producing property totaling $1,275 a month
| Date | Buyer | Sale Price | Title Company |
|---|---|---|---|
| Miller Andrew | $39,000 | None Available | |
| Rose Nathan B | -- | None Available | |
| Rose B Nathan | $52,000 | None Available | |
| Dye Richard S | $26,667 | None Available | |
| Wheeler Robert A | $55,000 | -- | |
| Beck Marlin | -- | -- | |
| Alexander Beck C | -- | -- | |
| Alexander Beck C | $45,000 | -- | |
| Beck Marlin | $25,000 | -- |
| Date | Status | Borrower | Loan Amount |
|---|---|---|---|
| Open | Miller Andrew | $29,250 | |
| Previous Owner | Dye Richard S | $40,000 |
| Date | Event | Price | Change | Sq Ft Price |
|---|---|---|---|---|
| 07/19/2016 07/19/16 | Sold | $39,000 | -41.8% | $23 / Sq Ft |
| 05/31/2016 05/31/16 | Pending | -- | -- | -- |
| 07/19/2013 07/19/13 | For Sale | $67,000 | -- | $39 / Sq Ft |
| Year | Tax Paid | Tax Assessment Tax Assessment Total Assessment is a certain percentage of the fair market value that is determined by local assessors to be the total taxable value of land and additions on the property. | Land | Improvement |
|---|---|---|---|---|
| 2024 | $1,263 | $36,060 | $2,140 | $33,920 |
| 2023 | $1,263 | $24,190 | $2,140 | $22,050 |
| 2022 | $943 | $24,190 | $2,140 | $22,050 |
| 2021 | $942 | $24,190 | $2,140 | $22,050 |
| 2020 | $851 | $21,040 | $1,860 | $19,180 |
| 2019 | $550 | $13,690 | $1,860 | $11,830 |
| 2018 | $675 | $13,690 | $1,860 | $11,830 |
| 2017 | $559 | $13,940 | $1,860 | $12,080 |
| 2016 | $841 | $13,940 | $1,860 | $12,080 |
| 2015 | $844 | $20,550 | $1,860 | $18,690 |
| 2014 | $844 | $20,550 | $1,860 | $18,690 |
| 2013 | $1,034 | $20,550 | $1,860 | $18,690 |
Seller's Agent in 2016
John Dye
Strong Real Estate Solutions
(419) 630-6453
64 in this area
100 Total Sales
Source: Northwest Ohio Real Estate Information Service (NORIS)
MLS Number: 5060056
APN: 072-020-13-011.000
Disclaimer: Certain information contained herein is derived from information provided by parties other than Homes.com. All information provided is deemed reliable, but is not guaranteed to be accurate and should be independently verified.
![]() IDX information is provided exclusively for personal, non-commercial use, and may not be used for any purpose other than to identify prospective properties consumers may be interested in purchasing. Information is deemed reliable but not guaranteed. ©2025 NORIS. All rights reserved.
IDX information is provided exclusively for personal, non-commercial use, and may not be used for any purpose other than to identify prospective properties consumers may be interested in purchasing. Information is deemed reliable but not guaranteed. ©2025 NORIS. All rights reserved.