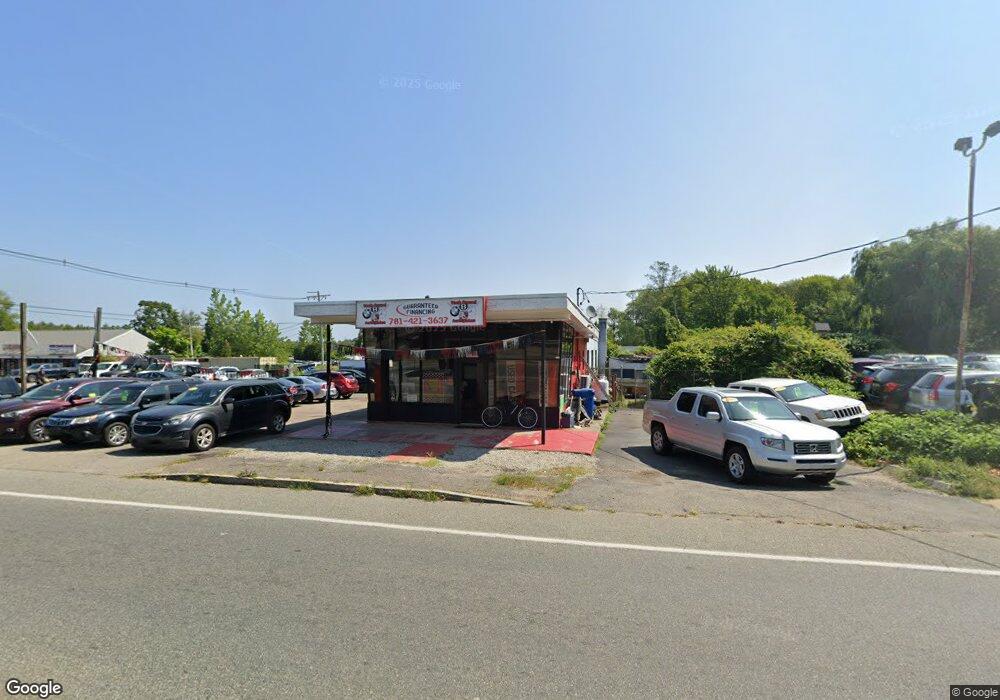
201 N Quincy St Abington, MA 02351
Estimated Value: $1,547,151
--
Bed
--
Bath
--
Sq Ft
1,742
Sq Ft Lot
About This Home
This home is located at 201 N Quincy St, Abington, MA 02351 and is currently estimated at $1,547,151. 201 N Quincy St is a home located in Plymouth County with nearby schools including Woodsdale School, Beaver Brook Elementary School, and Abington Middle School.
Ownership History
Date
Name
Owned For
Owner Type
Purchase Details
Closed on
Jan 3, 2012
Sold by
Gdg Rt
Bought by
Gdg Realty Holdings Ll
Current Estimated Value
Purchase Details
Closed on
Jan 25, 2011
Sold by
Mass Comm Of
Bought by
Cimino Tr Victor and Cimino Holly
Home Financials for this Owner
Home Financials are based on the most recent Mortgage that was taken out on this home.
Original Mortgage
$600,000
Interest Rate
4.62%
Mortgage Type
Commercial
Create a Home Valuation Report for This Property
The Home Valuation Report is an in-depth analysis detailing your home's value as well as a comparison with similar homes in the area
Home Values in the Area
Average Home Value in this Area
Purchase History
| Date | Buyer | Sale Price | Title Company |
|---|---|---|---|
| Gdg Realty Holdings Ll | -- | -- | |
| Cimino Tr Victor | $650,000 | -- |
Source: Public Records
Mortgage History
| Date | Status | Borrower | Loan Amount |
|---|---|---|---|
| Previous Owner | Cimino Tr Victor | $600,000 |
Source: Public Records
Tax History Compared to Growth
Tax History
| Year | Tax Paid | Tax Assessment Tax Assessment Total Assessment is a certain percentage of the fair market value that is determined by local assessors to be the total taxable value of land and additions on the property. | Land | Improvement |
|---|---|---|---|---|
| 2025 | $9,559 | $731,900 | $253,200 | $478,700 |
| 2024 | $9,793 | $731,900 | $253,200 | $478,700 |
| 2023 | $10,601 | $746,000 | $243,800 | $502,200 |
| 2022 | $11,219 | $737,100 | $234,900 | $502,200 |
| 2021 | $12,147 | $737,100 | $234,900 | $502,200 |
| 2020 | $10,161 | $597,700 | $201,100 | $396,600 |
| 2019 | $10,394 | $597,700 | $201,100 | $396,600 |
| 2018 | $4,956 | $597,700 | $201,100 | $396,600 |
| 2017 | $10,419 | $567,800 | $201,100 | $366,700 |
| 2016 | $10,181 | $567,800 | $201,100 | $366,700 |
| 2015 | $8,886 | $522,700 | $266,100 | $256,600 |
Source: Public Records
Map
Nearby Homes
- 698 N Quincy St
- 442 Hovendon Ave
- 704 N Quincy St
- 712 N Quincy St
- 436 Hovedon Ave
- 436 Hovendon Ave
- 436 Hovenden Ave
- 441 Hovendon Ave
- 117 Kevin Rd
- 169 N Quincy St
- 435 Hovendon Ave
- 103 Brookfield Dr
- 662 N Quincy St
- 123 Kevin Rd
- 428 Hovendon Ave
- 131 Kevin Rd
- 108 Brookfield Dr
- 99 Kevin Rd
- 656 N Quincy St
- 97 Brookfield Dr