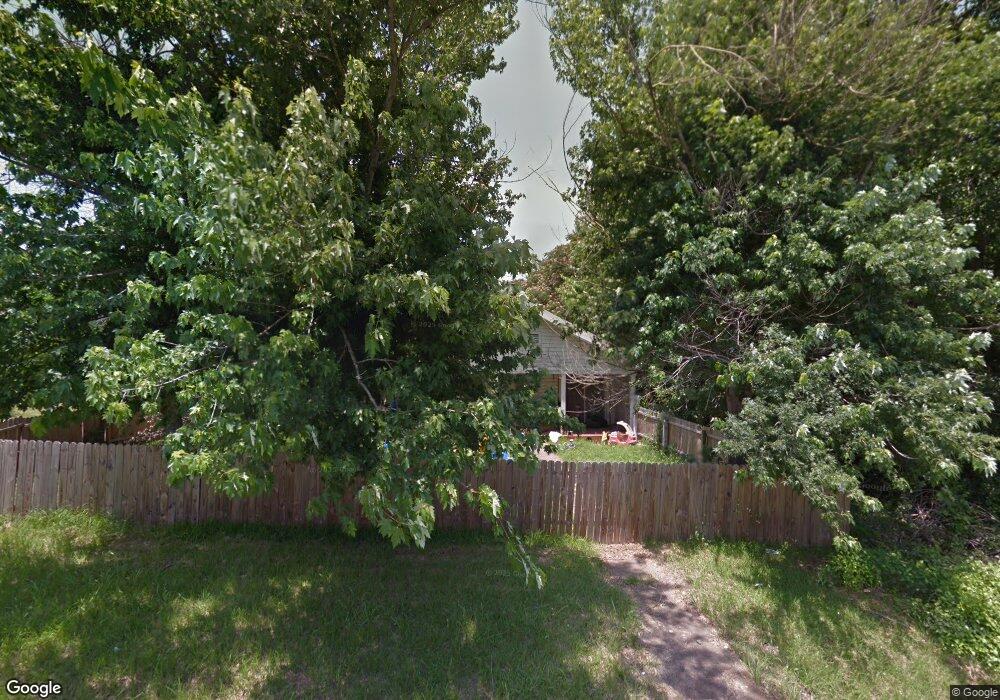
201 NE D St Antlers, OK 74523
Estimated Value: $63,753 - $140,000
2
Beds
1
Bath
1,048
Sq Ft
$99/Sq Ft
Est. Value
About This Home
This home is located at 201 NE D St, Antlers, OK 74523 and is currently estimated at $104,188, approximately $99 per square foot. 201 NE D St is a home located in Pushmataha County with nearby schools including Brantly Elementary School, Obuch Middle School, and Antlers High School.
Ownership History
Date
Name
Owned For
Owner Type
Purchase Details
Closed on
Oct 16, 2013
Sold by
Clark Cathy
Bought by
Autry David
Current Estimated Value
Purchase Details
Closed on
Sep 3, 2013
Sold by
Clark Chad Eric
Bought by
Clark Cathy
Purchase Details
Closed on
Jan 20, 2009
Sold by
Martin Catherine A Clark
Bought by
Clark Chad Eric
Purchase Details
Closed on
Aug 10, 2004
Sold by
Kendrick Robert M
Bought by
Martin Catherine A Clar
Purchase Details
Closed on
Aug 25, 2000
Sold by
Franks Rebecca Bex
Bought by
Kendrick Robert M
Purchase Details
Closed on
Sep 16, 1996
Sold by
Jackson Marty
Bought by
Franks Rebecca Bex
Create a Home Valuation Report for This Property
The Home Valuation Report is an in-depth analysis detailing your home's value as well as a comparison with similar homes in the area
Home Values in the Area
Average Home Value in this Area
Purchase History
| Date | Buyer | Sale Price | Title Company |
|---|---|---|---|
| Autry David | $14,500 | -- | |
| Clark Cathy | -- | -- | |
| Clark Chad Eric | -- | -- | |
| Martin Catherine A Clar | $28,000 | -- | |
| Kendrick Robert M | $16,000 | -- | |
| Franks Rebecca Bex | $7,500 | -- |
Source: Public Records
Tax History Compared to Growth
Tax History
| Year | Tax Paid | Tax Assessment Tax Assessment Total Assessment is a certain percentage of the fair market value that is determined by local assessors to be the total taxable value of land and additions on the property. | Land | Improvement |
|---|---|---|---|---|
| 2025 | $179 | $3,440 | $385 | $3,055 |
| 2024 | $179 | $3,440 | $385 | $3,055 |
| 2023 | $165 | $3,243 | $385 | $2,858 |
| 2022 | $157 | $3,148 | $495 | $2,653 |
| 2021 | $158 | $3,148 | $495 | $2,653 |
| 2020 | $158 | $3,148 | $495 | $2,653 |
| 2019 | $155 | $3,109 | $385 | $2,724 |
| 2018 | $155 | $3,114 | $385 | $2,729 |
| 2017 | $149 | $3,024 | $385 | $2,639 |
| 2016 | $142 | $2,936 | $385 | $2,551 |
| 2015 | $136 | $2,850 | $385 | $2,465 |
| 2014 | $153 | $3,077 | $432 | $2,645 |
Source: Public Records
Map
Nearby Homes