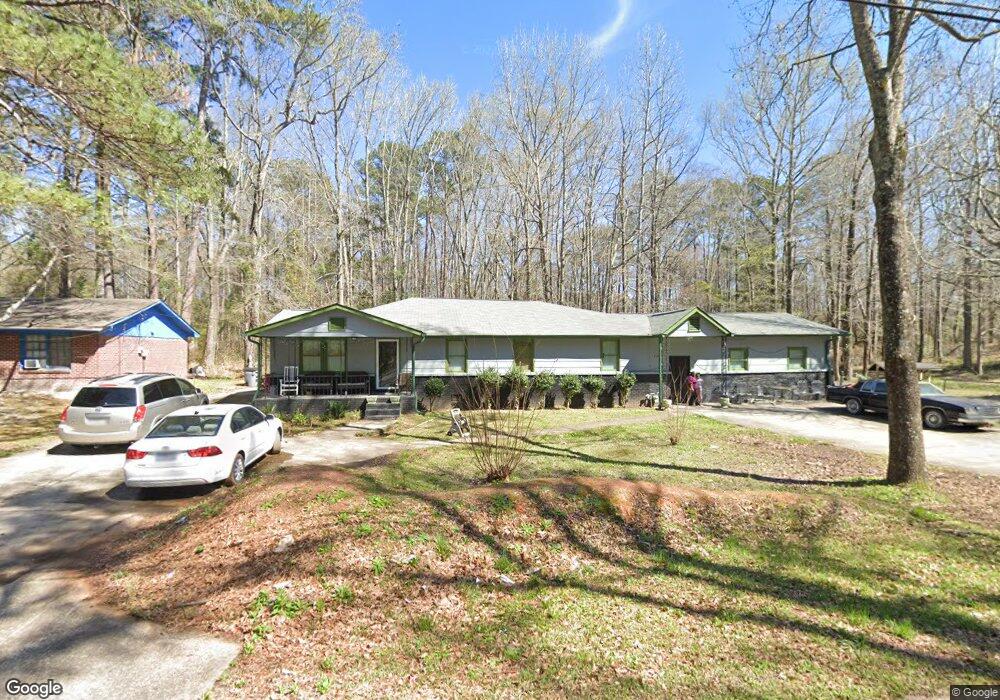
201 Niles St Lagrange, GA 30241
Estimated Value: $167,000 - $271,986
4
Beds
3
Baths
2,952
Sq Ft
$76/Sq Ft
Est. Value
About This Home
This home is located at 201 Niles St, Lagrange, GA 30241 and is currently estimated at $225,747, approximately $76 per square foot. 201 Niles St is a home located in Troup County with nearby schools including Hollis Hand Elementary School, Franklin Forest Elementary School, and Ethel W. Kight Elementary School.
Ownership History
Date
Name
Owned For
Owner Type
Purchase Details
Closed on
May 3, 1999
Sold by
Leola D Broughton
Bought by
Rogers Larry D and Rogers Ethel R
Current Estimated Value
Purchase Details
Closed on
Feb 11, 1999
Sold by
Andrew Williams
Bought by
Leola D Broughton
Purchase Details
Closed on
May 26, 1994
Sold by
Leola D W Broughton
Bought by
Andrew Williams
Purchase Details
Closed on
May 11, 1984
Sold by
Boughton
Bought by
Leola D W Broughton
Purchase Details
Closed on
Oct 12, 1983
Sold by
Andrew Williams
Bought by
Boughton
Purchase Details
Closed on
Jun 19, 1979
Sold by
Leola D Williams
Bought by
Andrew Williams
Purchase Details
Closed on
Oct 31, 1978
Sold by
Sara Lorenza and Sara Hutchinson
Bought by
Leola D Williams
Purchase Details
Closed on
Nov 4, 1977
Sold by
Don Jenkins
Bought by
Sara Lorenza and Sara Hutchinson
Purchase Details
Closed on
Jan 1, 1969
Bought by
Don Jenkins
Create a Home Valuation Report for This Property
The Home Valuation Report is an in-depth analysis detailing your home's value as well as a comparison with similar homes in the area
Purchase History
| Date | Buyer | Sale Price | Title Company |
|---|---|---|---|
| Rogers Larry D | $70,000 | -- | |
| Leola D Broughton | -- | -- | |
| Andrew Williams | -- | -- | |
| Leola D W Broughton | $1,000 | -- | |
| Boughton | -- | -- | |
| Andrew Williams | -- | -- | |
| Leola D Williams | $2,300 | -- | |
| Sara Lorenza | $2,000 | -- | |
| Don Jenkins | -- | -- |
Source: Public Records
Tax History
| Year | Tax Paid | Tax Assessment Tax Assessment Total Assessment is a certain percentage of the fair market value that is determined by local assessors to be the total taxable value of land and additions on the property. | Land | Improvement |
|---|---|---|---|---|
| 2025 | $1,714 | $94,136 | $11,880 | $82,256 |
| 2024 | $1,601 | $87,768 | $11,880 | $75,888 |
| 2023 | $1,068 | $68,204 | $11,880 | $56,324 |
| 2022 | $1,002 | $64,524 | $11,880 | $52,644 |
| 2021 | $883 | $57,996 | $1,560 | $56,436 |
| 2020 | $1,449 | $57,996 | $1,560 | $56,436 |
| 2019 | $410 | $23,560 | $1,560 | $22,000 |
| 2018 | $1,014 | $43,592 | $1,592 | $42,000 |
| 2017 | $1,014 | $43,592 | $1,592 | $42,000 |
| 2016 | $972 | $42,178 | $1,592 | $40,586 |
| 2015 | $973 | $42,178 | $1,592 | $40,586 |
| 2014 | $904 | $39,925 | $1,592 | $38,333 |
| 2013 | -- | $42,370 | $1,592 | $40,778 |
Source: Public Records
Map
Nearby Homes
- 205 Niles St
- 105 Niles St
- 103 Niles St
- 101 Niles St
- 308 E Render St
- 117 Belk St Unit 55
- 118 Belk St
- 118 Belk St Unit 59
- 209 Niles St
- 115 Belk St
- 115 Belk St Unit 54
- 113 Belk St
- 116 Belk St
- 112 Belk St
- 112 Belk St Unit 61
- 111 Belk St
- 111 Belk St Unit 52
- 110 Belk St
- 110 Belk St Unit 62
- 238 E Render St
Your Personal Tour Guide
Ask me questions while you tour the home.