201 Norma Cir Greenville, TX 75402
Mineral Heights NeighborhoodEstimated Value: $218,445 - $237,000
3
Beds
2
Baths
1,496
Sq Ft
$153/Sq Ft
Est. Value
About This Home
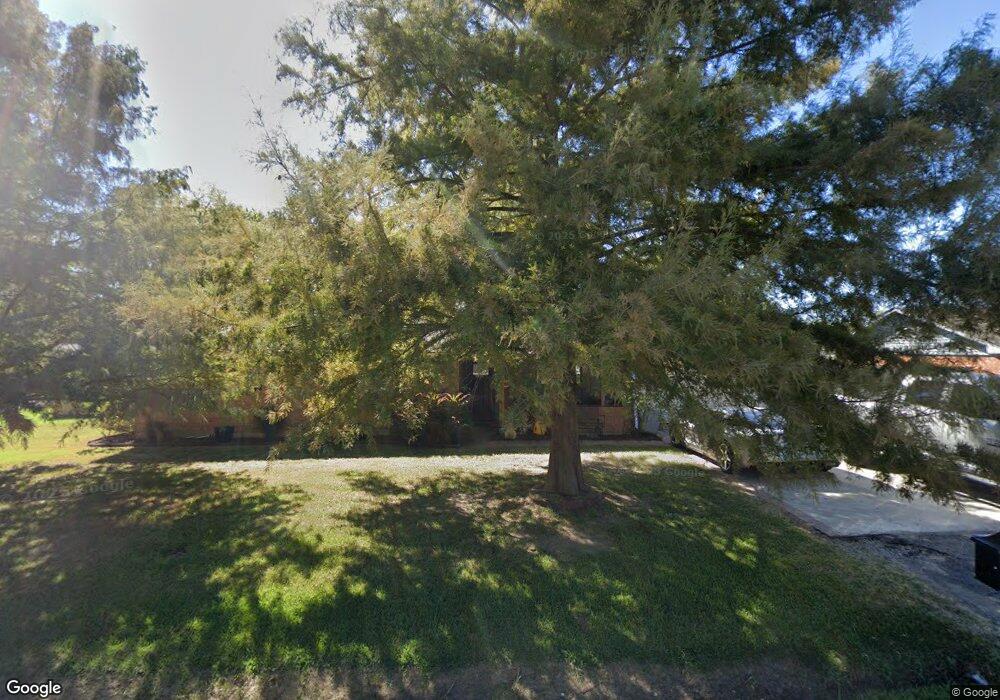
This home is located at 201 Norma Cir, Greenville, TX 75402 and is currently estimated at $228,611, approximately $152 per square foot. 201 Norma Cir is a home located in Hunt County with nearby schools including Bowie Elementary School, Travis Intermediate School, and Greenville Middle School.
Ownership History
Date
Name
Owned For
Owner Type
Purchase Details
Closed on
Sep 28, 2009
Sold by
Flowers Marvin P
Bought by
Reynolds Brandy M
Current Estimated Value
Home Financials for this Owner
Home Financials are based on the most recent Mortgage that was taken out on this home.
Original Mortgage
$85,914
Outstanding Balance
$56,215
Interest Rate
5.12%
Mortgage Type
FHA
Estimated Equity
$172,396
Create a Home Valuation Report for This Property
The Home Valuation Report is an in-depth analysis detailing your home's value as well as a comparison with similar homes in the area
Home Values in the Area
Average Home Value in this Area
Purchase History
| Date | Buyer | Sale Price | Title Company |
|---|---|---|---|
| Reynolds Brandy M | -- | Kincy Abs & Sabine Title Co |
Source: Public Records
Mortgage History
| Date | Status | Borrower | Loan Amount |
|---|---|---|---|
| Open | Reynolds Brandy M | $85,914 |
Source: Public Records
Tax History Compared to Growth
Tax History
| Year | Tax Paid | Tax Assessment Tax Assessment Total Assessment is a certain percentage of the fair market value that is determined by local assessors to be the total taxable value of land and additions on the property. | Land | Improvement |
|---|---|---|---|---|
| 2025 | $2,933 | $172,130 | -- | -- |
| 2024 | $2,933 | $156,482 | -- | -- |
| 2023 | $2,933 | $142,256 | $0 | $0 |
| 2022 | $2,900 | $129,324 | $0 | $0 |
| 2021 | $2,933 | $142,780 | $17,950 | $124,830 |
| 2020 | $2,789 | $121,280 | $15,670 | $105,610 |
| 2019 | $2,622 | $107,680 | $15,670 | $92,010 |
| 2018 | $2,430 | $88,330 | $11,970 | $76,360 |
| 2017 | $2,288 | $86,030 | $11,970 | $74,060 |
| 2016 | $2,080 | $75,270 | $11,680 | $63,590 |
| 2015 | $2,176 | $78,380 | $11,680 | $66,700 |
| 2014 | $2,176 | $84,100 | $11,680 | $72,420 |
Source: Public Records
Map
Nearby Homes