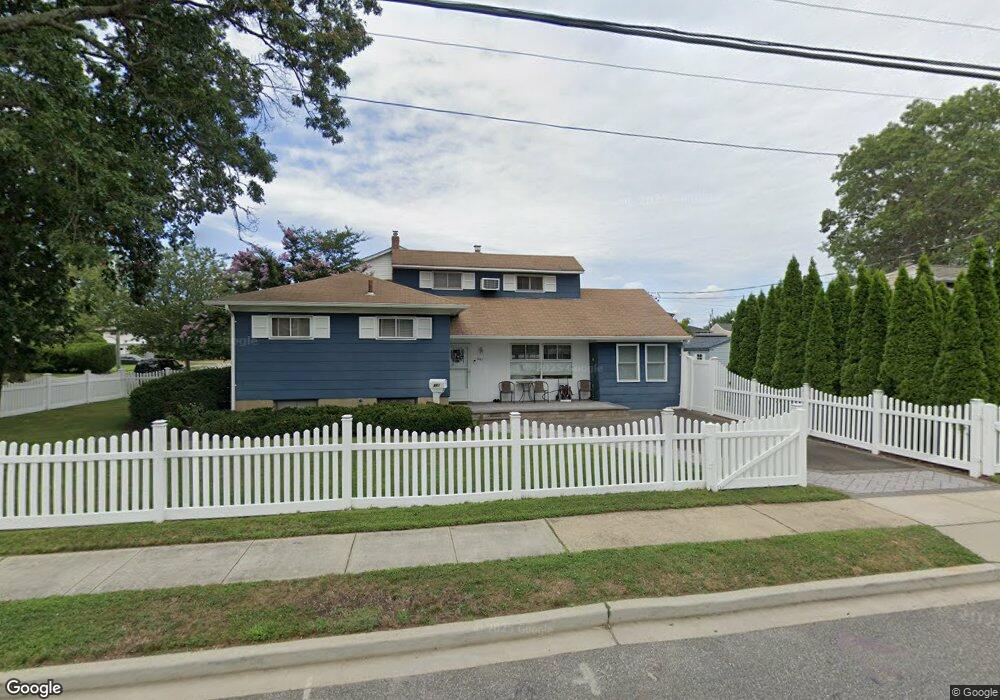
201 Oak St Massapequa Park, NY 11762
Estimated Value: $747,462 - $775,000
3
Beds
2
Baths
1,392
Sq Ft
$547/Sq Ft
Est. Value
About This Home
This home is located at 201 Oak St, Massapequa Park, NY 11762 and is currently estimated at $761,231, approximately $546 per square foot. 201 Oak St is a home located in Nassau County with nearby schools including Massapequa High School - Ames Campus, Berner Middle School, and Massapequa High School.
Ownership History
Date
Name
Owned For
Owner Type
Purchase Details
Closed on
Aug 29, 2016
Sold by
Kane Dawn L and Braun Leslie A
Bought by
Scannella Alex and Scammella Josephine
Current Estimated Value
Home Financials for this Owner
Home Financials are based on the most recent Mortgage that was taken out on this home.
Original Mortgage
$359,200
Outstanding Balance
$287,375
Interest Rate
3.48%
Mortgage Type
New Conventional
Estimated Equity
$473,856
Purchase Details
Closed on
Jan 8, 2016
Sold by
Scott Alfred Roy
Bought by
Kane Dawn L and Braun Leslie A
Create a Home Valuation Report for This Property
The Home Valuation Report is an in-depth analysis detailing your home's value as well as a comparison with similar homes in the area
Home Values in the Area
Average Home Value in this Area
Purchase History
| Date | Buyer | Sale Price | Title Company |
|---|---|---|---|
| Scannella Alex | $424,000 | The Judicial Title Insurance | |
| Kane Dawn L | -- | The Judicial Title Insurance |
Source: Public Records
Mortgage History
| Date | Status | Borrower | Loan Amount |
|---|---|---|---|
| Open | Scannella Alex | $359,200 |
Source: Public Records
Tax History Compared to Growth
Tax History
| Year | Tax Paid | Tax Assessment Tax Assessment Total Assessment is a certain percentage of the fair market value that is determined by local assessors to be the total taxable value of land and additions on the property. | Land | Improvement |
|---|---|---|---|---|
| 2025 | $12,588 | $470 | $180 | $290 |
| 2024 | $3,069 | $467 | $178 | $289 |
| 2023 | $11,519 | $497 | $190 | $307 |
| 2022 | $11,519 | $492 | $188 | $304 |
| 2021 | $10,420 | $494 | $189 | $305 |
| 2020 | $9,871 | $502 | $452 | $50 |
| 2019 | $2,353 | $559 | $472 | $87 |
| 2018 | $3,234 | $596 | $0 | $0 |
| 2017 | $3,234 | $633 | $475 | $158 |
| 2016 | $5,496 | $670 | $454 | $216 |
| 2015 | $2,095 | $707 | $479 | $228 |
| 2014 | $2,095 | $707 | $479 | $228 |
| 2013 | $2,051 | $743 | $503 | $240 |
Source: Public Records
Map
Nearby Homes