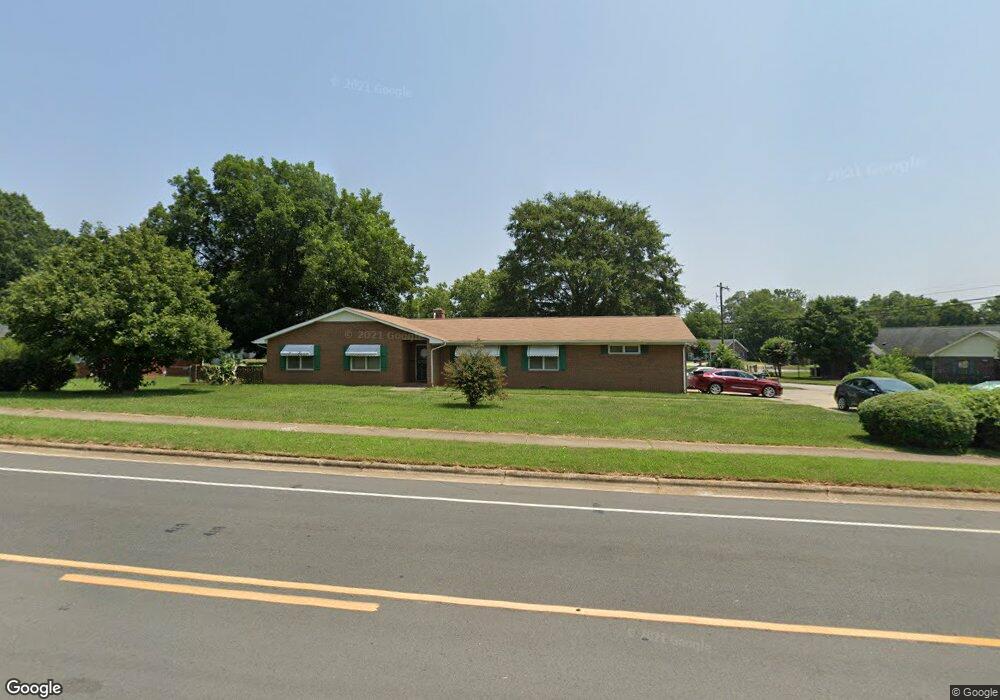
201 Old Concord Rd Salisbury, NC 28144
Estimated Value: $216,000 - $245,000
--
Bed
2
Baths
1,701
Sq Ft
$135/Sq Ft
Est. Value
About This Home
This home is located at 201 Old Concord Rd, Salisbury, NC 28144 and is currently estimated at $229,680, approximately $135 per square foot. 201 Old Concord Rd is a home located in Rowan County with nearby schools including Elizabeth Duncan Koontz Elementary School, Knox Middle School, and North Rowan Middle School.
Ownership History
Date
Name
Owned For
Owner Type
Purchase Details
Closed on
Aug 29, 2005
Sold by
Walker Michelle Denise
Bought by
Click Kenneth
Current Estimated Value
Home Financials for this Owner
Home Financials are based on the most recent Mortgage that was taken out on this home.
Original Mortgage
$85,500
Outstanding Balance
$45,513
Interest Rate
5.77%
Mortgage Type
Fannie Mae Freddie Mac
Estimated Equity
$184,167
Purchase Details
Closed on
Aug 26, 2005
Sold by
Patterson Mary Frances and Patterson Clyde
Bought by
Click Kenneth L
Home Financials for this Owner
Home Financials are based on the most recent Mortgage that was taken out on this home.
Original Mortgage
$85,500
Outstanding Balance
$45,513
Interest Rate
5.77%
Mortgage Type
Fannie Mae Freddie Mac
Estimated Equity
$184,167
Create a Home Valuation Report for This Property
The Home Valuation Report is an in-depth analysis detailing your home's value as well as a comparison with similar homes in the area
Home Values in the Area
Average Home Value in this Area
Purchase History
| Date | Buyer | Sale Price | Title Company |
|---|---|---|---|
| Click Kenneth | $90,000 | -- | |
| Click Kenneth L | -- | -- |
Source: Public Records
Mortgage History
| Date | Status | Borrower | Loan Amount |
|---|---|---|---|
| Open | Click Kenneth | $85,500 | |
| Closed | Click Kenneth L | $85,500 |
Source: Public Records
Tax History Compared to Growth
Tax History
| Year | Tax Paid | Tax Assessment Tax Assessment Total Assessment is a certain percentage of the fair market value that is determined by local assessors to be the total taxable value of land and additions on the property. | Land | Improvement |
|---|---|---|---|---|
| 2025 | $2,418 | $202,201 | $21,888 | $180,313 |
| 2024 | $2,418 | $202,201 | $21,888 | $180,313 |
| 2023 | $2,418 | $202,201 | $21,888 | $180,313 |
| 2022 | $1,673 | $121,470 | $17,510 | $103,960 |
| 2021 | $1,673 | $121,470 | $17,510 | $103,960 |
| 2020 | $1,673 | $121,470 | $17,510 | $103,960 |
| 2019 | $1,673 | $121,470 | $17,510 | $103,960 |
| 2018 | $1,432 | $105,412 | $17,510 | $87,902 |
| 2017 | $1,425 | $105,412 | $17,510 | $87,902 |
| 2016 | $1,386 | $105,412 | $17,510 | $87,902 |
| 2015 | $1,394 | $105,412 | $17,510 | $87,902 |
| 2014 | $1,430 | $109,415 | $17,510 | $91,905 |
Source: Public Records
Map
Nearby Homes
- 403 S Long St
- 430 E Horah St Unit 32
- 301 S Shaver St
- 420 E Bank St
- 409 E Fisher St
- 5 Cooper St
- 7 Cooper St
- 9 Cooper St
- 119 S Lee St Unit 3
- 115 W Thomas St
- 300 S Main St Unit K
- 209 S Main St
- 209 W Marsh St
- 322 S Church St
- 106 Crawford St
- 0 Harrel St
- 500 W Council St
- 719 S Jackson St
- 222 W McCubbins St
- 300 W Thomas St
- 510 S Shaver St
- 111 Old Concord Rd
- 522 Sonny Acres Dr
- 506 S Shaver St
- 602 S Shaver St
- 105 Old Concord Rd
- 514 Sonny Acres Dr
- 515 S Shaver St
- 513 S Shaver St
- 502 S Shaver St
- 528 Sonny Acres Dr
- 508 Sonny Acres Dr
- 101 Old Concord Rd
- 608 S Shaver St
- 610 S Shaver St
- 525 Sonny Acres Dr
- 519 Sonny Acres Dr
- 416 S Shaver St
- 416 S Shaver St
- 531 Sonny Acres Dr