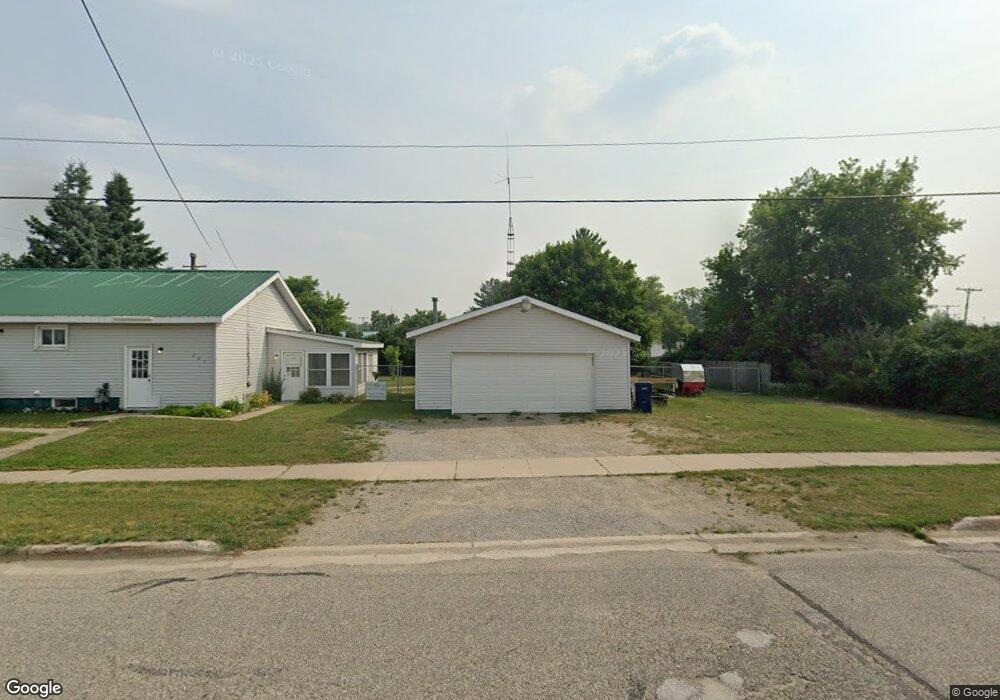
201 Oliver St Grayling, MI 49738
Estimated Value: $124,906 - $132,000
2
Beds
1
Bath
1,200
Sq Ft
$107/Sq Ft
Est. Value
About This Home
This home is located at 201 Oliver St, Grayling, MI 49738 and is currently estimated at $128,727, approximately $107 per square foot. 201 Oliver St is a home located in Crawford County with nearby schools including Grayling Elementary School, Grayling Middle School, and Grayling High School.
Ownership History
Date
Name
Owned For
Owner Type
Purchase Details
Closed on
May 21, 2023
Sold by
Willoughby Sharon A
Bought by
Willoughby Sharon Trust
Current Estimated Value
Purchase Details
Closed on
Aug 22, 2014
Bought by
Willoughby Sharon A
Purchase Details
Closed on
Mar 20, 2013
Sold by
Jpmorgan Chase Bank
Bought by
Perry Willian Timothy
Purchase Details
Closed on
Jan 11, 2012
Sold by
Perry William Timothy and Moran Nicole M
Bought by
Perry William Timothy
Purchase Details
Closed on
Sep 29, 2005
Bought by
Perry William T and Moran Nicole M
Purchase Details
Closed on
Oct 30, 1998
Sold by
Diemert Julia
Bought by
Diemert Terry and Wf Julia
Purchase Details
Closed on
Oct 18, 1994
Sold by
Diemert Julia
Purchase Details
Closed on
Feb 1, 1988
Sold by
Carr Allen and Wf Deloris
Bought by
Diemert Julia
Purchase Details
Closed on
Jun 6, 1986
Sold by
Case Dennis R
Bought by
Case Julia L
Purchase Details
Closed on
Mar 7, 1981
Sold by
Case Doris and Case Dora
Bought by
Case Dennis R
Create a Home Valuation Report for This Property
The Home Valuation Report is an in-depth analysis detailing your home's value as well as a comparison with similar homes in the area
Home Values in the Area
Average Home Value in this Area
Purchase History
We collect this data history from publicly available records. To have your information removed, we recommend requesting removal directly through your county’s website.
| Date | Buyer | Sale Price | Title Company |
|---|---|---|---|
| Willoughby Sharon Trust | -- | -- | |
| Willoughby Sharon A | $37,500 | -- | |
| Perry Willian Timothy | $34,850 | -- | |
| Perry William Timothy | -- | -- | |
| Perry William T | $73,000 | -- | |
| Diemert Terry | -- | -- | |
| -- | -- | -- | |
| Diemert Julia | -- | -- | |
| Case Julia L | -- | -- | |
| Case Dennis R | -- | -- |
Source: Public Records
Tax History
| Year | Tax Paid | Tax Assessment Tax Assessment Total Assessment is a certain percentage of the fair market value that is determined by local assessors to be the total taxable value of land and additions on the property. | Land | Improvement |
|---|---|---|---|---|
| 2025 | $1,905 | $54,900 | $54,900 | $0 |
| 2024 | $1,862 | $52,000 | $52,000 | $0 |
| 2023 | $1,695 | $40,500 | $40,500 | $0 |
| 2022 | $1,611 | $35,800 | $35,800 | $0 |
| 2021 | $1,831 | $34,000 | $34,000 | $0 |
| 2020 | $1,806 | $32,800 | $32,800 | $0 |
| 2019 | $1,768 | $32,300 | $32,300 | $0 |
| 2018 | $1,733 | $29,800 | $29,800 | $0 |
| 2017 | $1,509 | $30,000 | $30,000 | $0 |
| 2016 | $1,496 | $26,900 | $26,900 | $0 |
| 2015 | -- | $26,900 | $0 | $0 |
| 2014 | -- | $28,000 | $0 | $0 |
| 2013 | -- | $27,700 | $0 | $0 |
Source: Public Records
Map
Nearby Homes
- 110 State St
- 102 Madsen St
- 444 Interstate 75 Business Loop
- 403 Erie St
- 000 W M-72 Hwy
- 32 AC E Railroad Trail
- 1107 Ogemaw St
- 1205 E Michigan Ave
- 809 Maple St
- 1301 W North Down River Rd
- 4851 W North Down River Rd
- 5973 W M-72 Hwy
- 1024 S I-75 Business Loop
- V/L L71-75 Evergreen Dr
- 310 N Arthur St
- 309 Lillian St
- 390 E Ember Trail
- 6440 Richard Rd
- V/L Lot 9 Norseman Dr
- V/L Lot 2 Norseman Dr
Your Personal Tour Guide
Ask me questions while you tour the home.