Estimated Value: $347,000 - $709,000
3
Beds
2
Baths
2,814
Sq Ft
$179/Sq Ft
Est. Value
About This Home
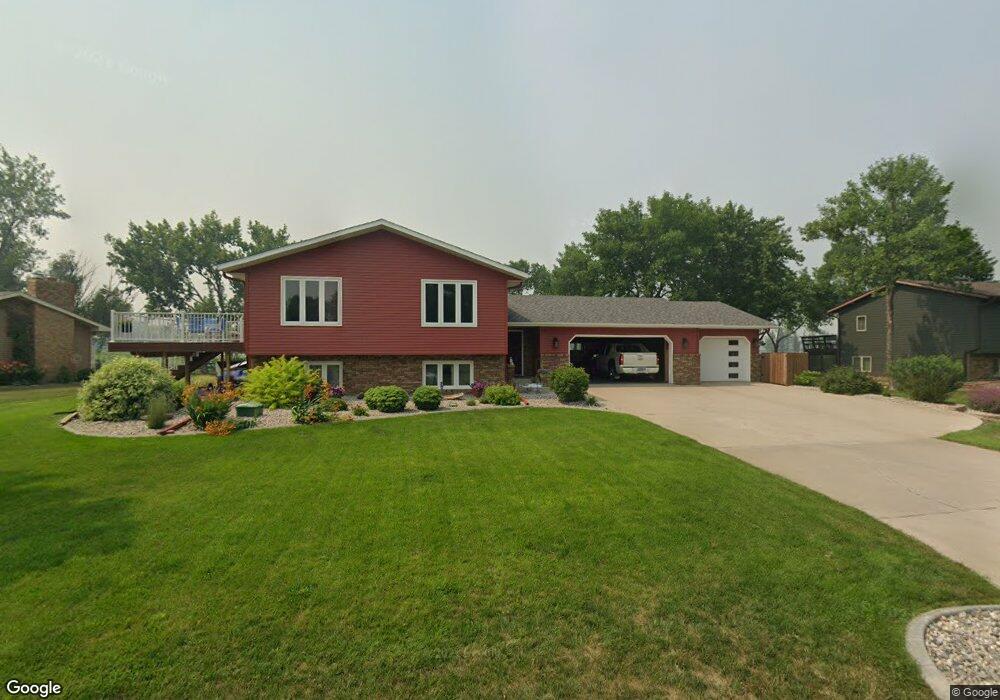
This home is located at 201 Oxbow Cir, Oxbow, ND 58047 and is currently estimated at $502,576, approximately $178 per square foot. 201 Oxbow Cir is a home located in Cass County with nearby schools including Kindred Elementary School and Kindred High School.
Ownership History
Date
Name
Owned For
Owner Type
Purchase Details
Closed on
Oct 4, 2019
Sold by
Sharpe Shane J
Bought by
Heyerman Lisa and Heyerman David L
Current Estimated Value
Home Financials for this Owner
Home Financials are based on the most recent Mortgage that was taken out on this home.
Original Mortgage
$98,000
Outstanding Balance
$85,853
Interest Rate
3.5%
Mortgage Type
New Conventional
Estimated Equity
$416,723
Purchase Details
Closed on
Nov 2, 2016
Sold by
Sharpe Shane J and Sharpe Jennifer L
Bought by
Sharpe Shane J and Sharpe Jennifer L
Create a Home Valuation Report for This Property
The Home Valuation Report is an in-depth analysis detailing your home's value as well as a comparison with similar homes in the area
Purchase History
| Date | Buyer | Sale Price | Title Company |
|---|---|---|---|
| Heyerman Lisa | $315,000 | Title Co | |
| Sharpe Shane J | -- | None Available |
Source: Public Records
Mortgage History
| Date | Status | Borrower | Loan Amount |
|---|---|---|---|
| Open | Heyerman Lisa | $98,000 |
Source: Public Records
Tax History
| Year | Tax Paid | Tax Assessment Tax Assessment Total Assessment is a certain percentage of the fair market value that is determined by local assessors to be the total taxable value of land and additions on the property. | Land | Improvement |
|---|---|---|---|---|
| 2024 | $3,531 | $181,200 | $20,400 | $160,800 |
| 2023 | $3,768 | $174,600 | $20,400 | $154,200 |
| 2022 | $3,852 | $164,650 | $20,400 | $144,250 |
| 2021 | $2,865 | $154,750 | $20,400 | $134,350 |
| 2020 | $2,878 | $149,300 | $20,400 | $128,900 |
| 2019 | $2,829 | $149,300 | $20,400 | $128,900 |
| 2018 | $3,390 | $147,950 | $20,400 | $127,550 |
| 2017 | $3,909 | $145,100 | $20,400 | $124,700 |
| 2016 | $3,081 | $109,900 | $17,650 | $92,250 |
| 2015 | $2,364 | $78,500 | $12,600 | $65,900 |
| 2014 | $2,145 | $74,750 | $12,000 | $62,750 |
| 2013 | $2,103 | $70,500 | $11,300 | $59,200 |
Source: Public Records
Map
Nearby Homes
- 204 Oxbow Cir
- 776 Riverbend Rd
- TBD S Schnell Dr
- 1742 160th Ave S
- 8239 Hebgen Dr
- 8233 Hebgen Dr
- ### County Road 17 S
- 1758 108th Ave S
- 1075 Saltwater Way Bypass
- 1025 Saltwater Way
- 9350 and 9124 57th
- 10358 Burgundy Dr
- 10350 Burgundy Dr
- 10342 Burgundy Dr
- 10202 Burgundy Dr
- 1250 76th Ave S
- 10210 73rd St S
- 10219 73rd St S
- 10218 73rd St S
- 10366 73rd St S
Your Personal Tour Guide
Ask me questions while you tour the home.