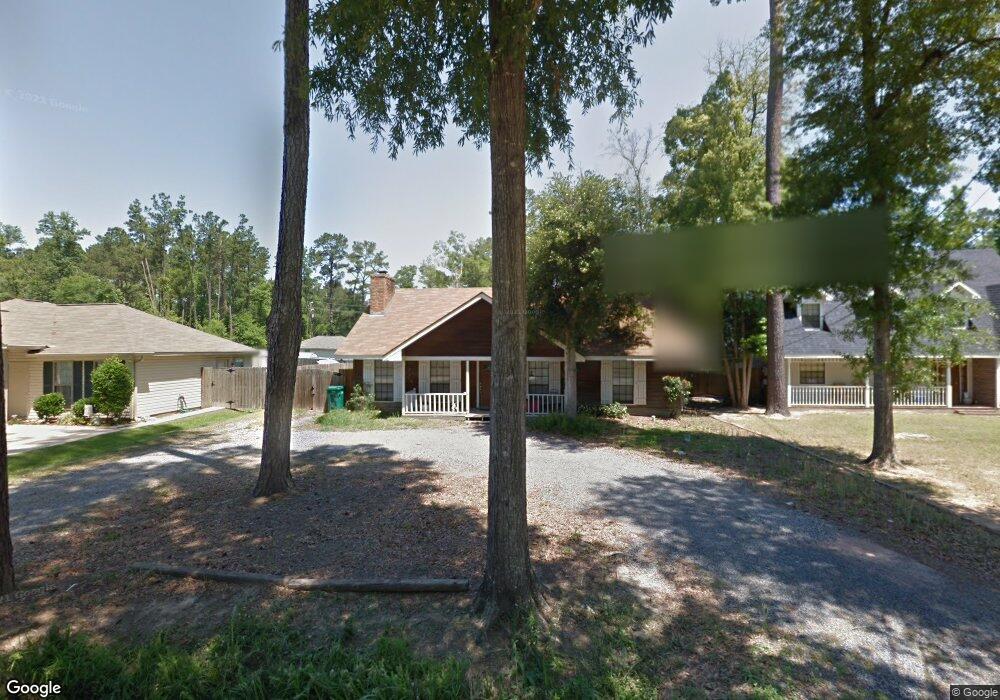
201 Pear St Covington, LA 70433
Estimated Value: $229,000 - $308,000
4
Beds
3
Baths
2,007
Sq Ft
$133/Sq Ft
Est. Value
About This Home
This home is located at 201 Pear St, Covington, LA 70433 and is currently estimated at $267,284, approximately $133 per square foot. 201 Pear St is a home located in St. Tammany Parish with nearby schools including Marigny Elementary School, Lake Harbor Middle School, and Magnolia Trace Elementary School.
Ownership History
Date
Name
Owned For
Owner Type
Purchase Details
Closed on
Sep 17, 2009
Sold by
Zar Carol Ann Perry and Gerrets Damon J
Bought by
Temple Michael M
Current Estimated Value
Home Financials for this Owner
Home Financials are based on the most recent Mortgage that was taken out on this home.
Original Mortgage
$159,183
Outstanding Balance
$103,306
Interest Rate
5.36%
Mortgage Type
New Conventional
Estimated Equity
$163,978
Create a Home Valuation Report for This Property
The Home Valuation Report is an in-depth analysis detailing your home's value as well as a comparison with similar homes in the area
Home Values in the Area
Average Home Value in this Area
Purchase History
| Date | Buyer | Sale Price | Title Company |
|---|---|---|---|
| Temple Michael M | $156,000 | None Available |
Source: Public Records
Mortgage History
| Date | Status | Borrower | Loan Amount |
|---|---|---|---|
| Open | Temple Michael M | $159,183 |
Source: Public Records
Tax History
| Year | Tax Paid | Tax Assessment Tax Assessment Total Assessment is a certain percentage of the fair market value that is determined by local assessors to be the total taxable value of land and additions on the property. | Land | Improvement |
|---|---|---|---|---|
| 2025 | $1,310 | $18,424 | $2,678 | $15,746 |
| 2024 | $1,310 | $18,424 | $2,678 | $15,746 |
| 2023 | $1,359 | $15,799 | $2,678 | $13,121 |
| 2022 | $110,003 | $15,799 | $2,678 | $13,121 |
| 2021 | $1,098 | $15,799 | $2,678 | $13,121 |
| 2020 | $1,097 | $15,799 | $2,678 | $13,121 |
| 2019 | $2,103 | $15,339 | $2,600 | $12,739 |
| 2018 | $2,106 | $15,339 | $2,600 | $12,739 |
| 2017 | $2,126 | $15,339 | $2,600 | $12,739 |
| 2016 | $2,142 | $15,339 | $2,600 | $12,739 |
| 2015 | $926 | $13,954 | $2,600 | $11,354 |
| 2014 | $916 | $13,954 | $2,600 | $11,354 |
| 2013 | -- | $13,954 | $2,600 | $11,354 |
Source: Public Records
Map
Nearby Homes
- 214 Pear St
- 150 Bodet Rd
- 201 Walnut St
- 0 Walnut St
- 211 Tallowwood Dr S
- 2025 Christie Ln S Unit 24
- LOT 6 Rhonda Ct
- 0 Ponchitolawa Dr
- 330 Westwood Dr
- 139 Crepemyrtle Rd
- 121 North Dr
- 599 Dove Park Rd
- 0 U S 190 Service Rd
- 0 U S 190 Service Rd Unit 2434896
- 0 U S 190 Service Rd Unit 2542160
- 124 Country Club Dr
Your Personal Tour Guide
Ask me questions while you tour the home.