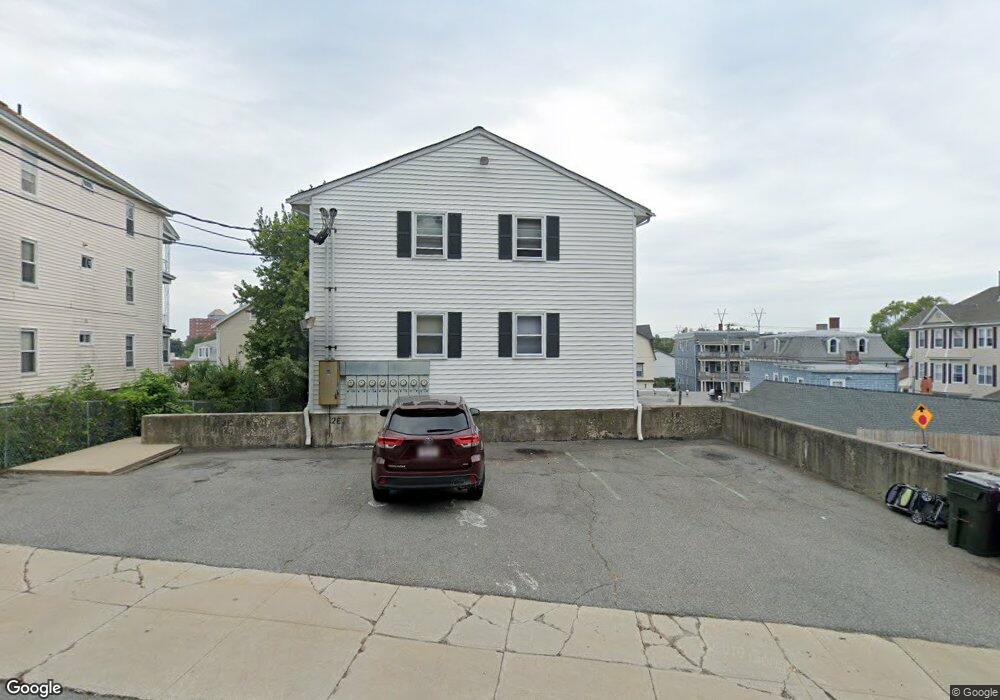
201 Pearce St Unit 2W Fall River, MA 02720
Lower Highlands NeighborhoodEstimated Value: $214,000 - $274,000
2
Beds
1
Bath
768
Sq Ft
$328/Sq Ft
Est. Value
About This Home
This home is located at 201 Pearce St Unit 2W, Fall River, MA 02720 and is currently estimated at $251,949, approximately $328 per square foot. 201 Pearce St Unit 2W is a home located in Bristol County with nearby schools including Mary Fonseca Elementary School, Morton Middle School, and B M C Durfee High School.
Ownership History
Date
Name
Owned For
Owner Type
Purchase Details
Closed on
Dec 10, 2004
Sold by
Couto Paula M and Botelho Steven D
Bought by
Robinson Oliver W
Current Estimated Value
Home Financials for this Owner
Home Financials are based on the most recent Mortgage that was taken out on this home.
Original Mortgage
$91,800
Outstanding Balance
$45,667
Interest Rate
5.63%
Mortgage Type
Purchase Money Mortgage
Estimated Equity
$206,282
Purchase Details
Closed on
Nov 22, 2000
Sold by
Botelho Roger and Botelho Linda J
Bought by
Teves Kevin C and Teves Catrina D
Home Financials for this Owner
Home Financials are based on the most recent Mortgage that was taken out on this home.
Original Mortgage
$133,350
Interest Rate
7.78%
Mortgage Type
Purchase Money Mortgage
Purchase Details
Closed on
Apr 23, 1987
Sold by
Ford Timothy M
Bought by
Botelho Steven D
Home Financials for this Owner
Home Financials are based on the most recent Mortgage that was taken out on this home.
Original Mortgage
$56,200
Interest Rate
8.97%
Mortgage Type
Purchase Money Mortgage
Create a Home Valuation Report for This Property
The Home Valuation Report is an in-depth analysis detailing your home's value as well as a comparison with similar homes in the area
Home Values in the Area
Average Home Value in this Area
Purchase History
| Date | Buyer | Sale Price | Title Company |
|---|---|---|---|
| Robinson Oliver W | $102,000 | -- | |
| Teves Kevin C | $137,500 | -- | |
| Botelho Steven D | $62,500 | -- |
Source: Public Records
Mortgage History
| Date | Status | Borrower | Loan Amount |
|---|---|---|---|
| Open | Botelho Steven D | $91,800 | |
| Previous Owner | Botelho Steven D | $133,350 | |
| Previous Owner | Botelho Steven D | $56,200 |
Source: Public Records
Tax History
| Year | Tax Paid | Tax Assessment Tax Assessment Total Assessment is a certain percentage of the fair market value that is determined by local assessors to be the total taxable value of land and additions on the property. | Land | Improvement |
|---|---|---|---|---|
| 2025 | $2,162 | $188,800 | $0 | $188,800 |
| 2024 | $1,529 | $133,100 | $0 | $133,100 |
| 2023 | $1,480 | $120,600 | $0 | $120,600 |
| 2022 | $1,424 | $124,400 | $0 | $124,400 |
| 2021 | $1,424 | $103,000 | $0 | $103,000 |
| 2020 | $1,110 | $76,800 | $0 | $76,800 |
| 2019 | $1,079 | $74,000 | $0 | $74,000 |
| 2018 | $1,026 | $70,200 | $0 | $70,200 |
| 2017 | $983 | $70,200 | $0 | $70,200 |
| 2016 | $930 | $68,200 | $0 | $68,200 |
| 2015 | $912 | $69,700 | $0 | $69,700 |
| 2014 | $945 | $75,100 | $0 | $75,100 |
Source: Public Records
Map
Nearby Homes
- 11 Dyer St
- 327 Brownell St
- 909 High St Unit 1
- 889 High St
- 33-35 Malvey St
- 10 N Court St Unit 3
- 267 Lincoln Ave
- 750 Davol St Unit 1012
- 750 Davol St Unit 219
- 750 Davol St Unit 221
- 750 Davol St Unit 616
- 750 Davol St Unit 214
- 72 Belmont St
- 575 N Main St
- 302 Cory St
- 503 Highland Ave
- 376 N Underwood St
- 339 Danforth St Unit 6
- 337 Danforth St Unit 7
- 213 Weetamoe St
- 201 Pearce St Unit 3 East
- 201 Pearce St Unit 3E
- 201 Pearce St Unit 3W
- 201 Pearce St Unit 2E
- 201 Pearce St Unit 1E
- 201 Pearce St Unit 1W
- 201 Pearce St Unit 6
- 201 Pearce St Unit 4
- 201 Pearce St Unit 5
- 961 N Main St
- 324 Barnaby St
- 324 Barnaby St Unit 3
- 951 N Main St
- 983 N Main St
- 983 N Main St
- 656 June St
- 210 Pearce St
- 646 June St
- 306 Barnaby St
- 688 June St
Your Personal Tour Guide
Ask me questions while you tour the home.