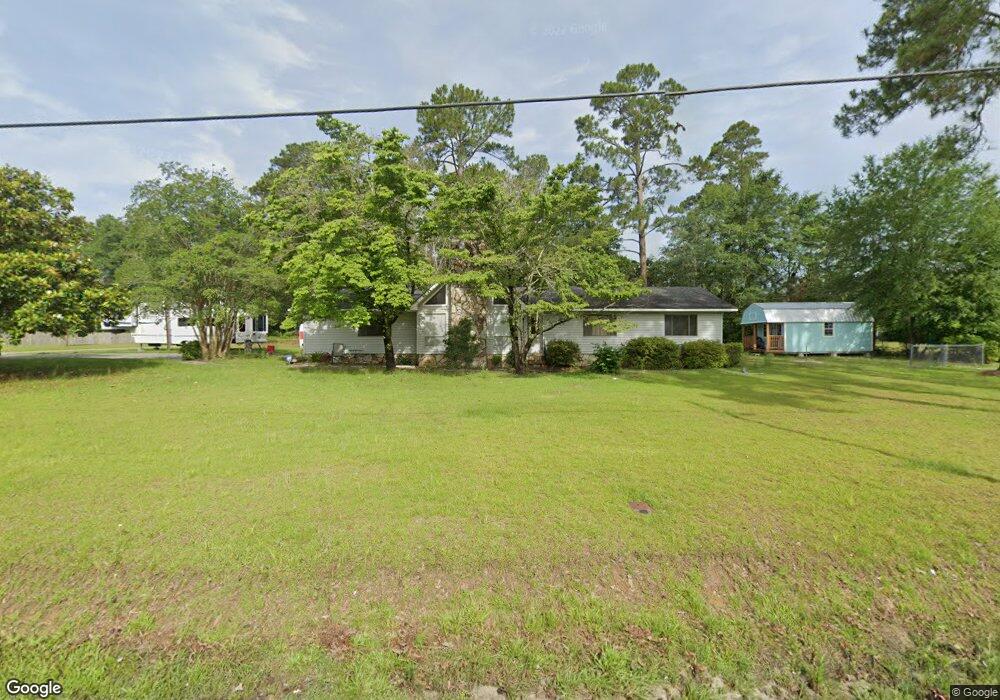
201 Peg Wen Blvd Statesboro, GA 30461
Estimated Value: $257,890 - $284,000
3
Beds
2
Baths
1,880
Sq Ft
$144/Sq Ft
Est. Value
About This Home
This home is located at 201 Peg Wen Blvd, Statesboro, GA 30461 and is currently estimated at $271,223, approximately $144 per square foot. 201 Peg Wen Blvd is a home located in Bulloch County with nearby schools including Statesboro High School, Mill Creek Elementary School, and Langston Chapel Middle School.
Ownership History
Date
Name
Owned For
Owner Type
Purchase Details
Closed on
Jul 30, 2021
Sold by
Rahman Mosfequr
Bought by
Hart David Wayne
Current Estimated Value
Home Financials for this Owner
Home Financials are based on the most recent Mortgage that was taken out on this home.
Original Mortgage
$177,777
Outstanding Balance
$161,654
Interest Rate
2.9%
Mortgage Type
New Conventional
Estimated Equity
$109,569
Purchase Details
Closed on
Oct 9, 2020
Sold by
Iager Larry H
Bought by
Rahman Mosfequr
Home Financials for this Owner
Home Financials are based on the most recent Mortgage that was taken out on this home.
Original Mortgage
$100,500
Interest Rate
2.8%
Mortgage Type
New Conventional
Purchase Details
Closed on
Oct 1, 2003
Bought by
Iager Family Irrevocable Trust C/O Linda
Purchase Details
Closed on
Aug 1, 2001
Bought by
Smith Sherry D
Purchase Details
Closed on
Nov 1, 1995
Bought by
Grant Darren Page
Create a Home Valuation Report for This Property
The Home Valuation Report is an in-depth analysis detailing your home's value as well as a comparison with similar homes in the area
Home Values in the Area
Average Home Value in this Area
Purchase History
| Date | Buyer | Sale Price | Title Company |
|---|---|---|---|
| Hart David Wayne | $176,000 | -- | |
| Rahman Mosfequr | $137,000 | -- | |
| Iager Family Irrevocable Trust C/O Linda | -- | -- | |
| Smith Sherry D | -- | -- | |
| Smith William O | -- | -- | |
| Grant Darren Page | -- | -- |
Source: Public Records
Mortgage History
| Date | Status | Borrower | Loan Amount |
|---|---|---|---|
| Open | Hart David Wayne | $177,777 | |
| Previous Owner | Rahman Mosfequr | $100,500 |
Source: Public Records
Tax History Compared to Growth
Tax History
| Year | Tax Paid | Tax Assessment Tax Assessment Total Assessment is a certain percentage of the fair market value that is determined by local assessors to be the total taxable value of land and additions on the property. | Land | Improvement |
|---|---|---|---|---|
| 2024 | $2,255 | $82,280 | $14,000 | $68,280 |
| 2023 | $1,842 | $64,320 | $9,160 | $55,160 |
| 2022 | $1,115 | $56,867 | $9,168 | $47,699 |
| 2021 | $902 | $44,704 | $9,168 | $35,536 |
| 2020 | $886 | $42,692 | $9,168 | $33,524 |
| 2019 | $897 | $43,001 | $9,240 | $33,761 |
| 2018 | $865 | $39,758 | $9,240 | $30,518 |
| 2017 | $855 | $38,818 | $9,240 | $29,578 |
| 2016 | $859 | $38,026 | $9,240 | $28,786 |
| 2015 | $858 | $37,800 | $9,240 | $28,560 |
| 2014 | $788 | $37,800 | $9,240 | $28,560 |
Source: Public Records
Map
Nearby Homes
- 107 Bel Air Dr
- 218 Somera Ln
- The Magnolia Plan at Belair East
- The Aspen Plan at Belair East
- The Loblolly Plan at Belair East
- The Holly Plan at Belair East
- The Birch Plan at Belair East
- The Cypress Plan at Belair East
- The Dogwood Plan at Belair East
- 317 Somera Ln
- 303 Somera Ln
- 23606 Us Highway 80 E
- 306 Somera Ln
- 128 Hamner Dr
- 115 Sandy Way
- 0 Henry Blvd Unit 10609902
- 313 Somera Ln
- 309 Somera Ln
- 173 Timber Cove
- 0 Northside Dr E Unit 10610985
- 203 Peg Wen Blvd
- 202 Peg Wen Blvd
- 204 Peg Wen Blvd
- 209 Bel Air Dr
- 104 Peg Wen Blvd
- 206 Peg Wen Blvd
- 205 Peg Wen Blvd
- 207 Bel Air Dr
- 212 Bel Air Dr
- 0 Camaro Ct Unit 8305522
- 205 Bel Air Dr
- 104 Camaro Ct
- 300 Peg Wen Blvd
- 210 Bel Air Dr
- 301 Peg Wen Blvd
- 103 Camero Ct
- 103 Camaro Ct
- 204 Bel Air Dr
- 208 Bel Air Dr
- 106 Camaro Ct