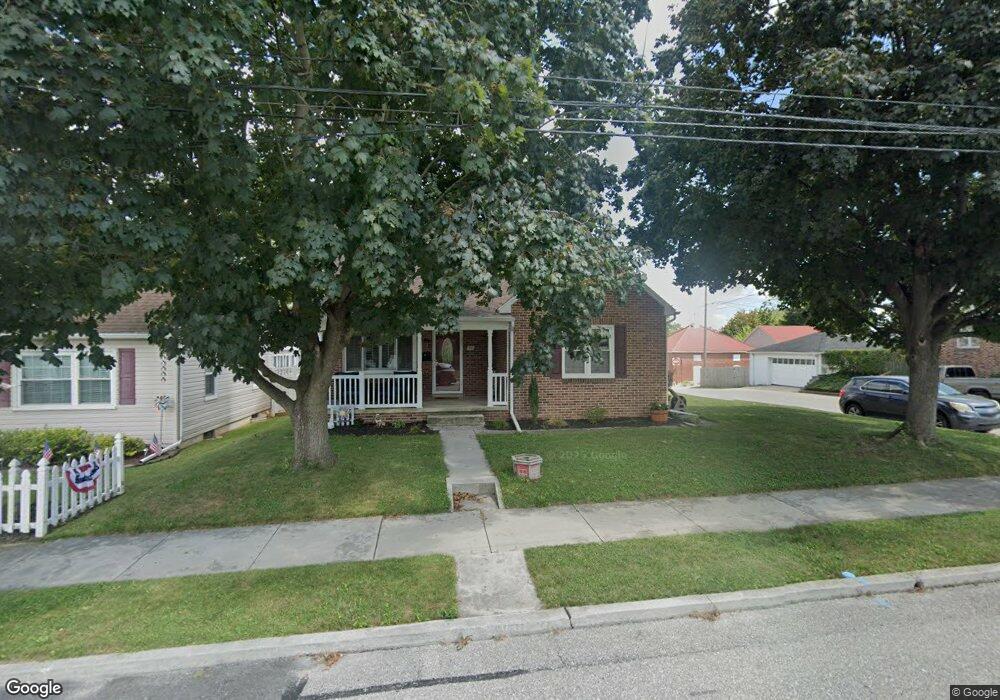
201 Penn St Hanover, PA 17331
Hanover Historic District NeighborhoodEstimated Value: $221,497 - $279,000
2
Beds
1
Bath
1,512
Sq Ft
$160/Sq Ft
Est. Value
About This Home
This home is located at 201 Penn St, Hanover, PA 17331 and is currently estimated at $241,874, approximately $159 per square foot. 201 Penn St is a home located in York County with nearby schools including Washington Elementary School, Clearview Elementary School, and Hanover Middle School.
Ownership History
Date
Name
Owned For
Owner Type
Purchase Details
Closed on
Aug 29, 2002
Sold by
Miller Anthony R and Miller Kim M
Bought by
Bish David A and Bish Christine A
Current Estimated Value
Home Financials for this Owner
Home Financials are based on the most recent Mortgage that was taken out on this home.
Original Mortgage
$123,325
Outstanding Balance
$52,081
Interest Rate
6.39%
Mortgage Type
FHA
Estimated Equity
$189,793
Purchase Details
Closed on
Jul 3, 1996
Bought by
Miller Anthony R
Create a Home Valuation Report for This Property
The Home Valuation Report is an in-depth analysis detailing your home's value as well as a comparison with similar homes in the area
Home Values in the Area
Average Home Value in this Area
Purchase History
| Date | Buyer | Sale Price | Title Company |
|---|---|---|---|
| Bish David A | $124,300 | -- | |
| Miller Anthony R | $86,900 | -- |
Source: Public Records
Mortgage History
| Date | Status | Borrower | Loan Amount |
|---|---|---|---|
| Open | Bish David A | $123,325 |
Source: Public Records
Tax History
| Year | Tax Paid | Tax Assessment Tax Assessment Total Assessment is a certain percentage of the fair market value that is determined by local assessors to be the total taxable value of land and additions on the property. | Land | Improvement |
|---|---|---|---|---|
| 2025 | $4,242 | $115,860 | $25,010 | $90,850 |
| 2024 | $4,209 | $115,860 | $25,010 | $90,850 |
| 2023 | $4,177 | $115,860 | $25,010 | $90,850 |
| 2022 | $4,126 | $115,860 | $25,010 | $90,850 |
| 2021 | $4,010 | $115,860 | $25,010 | $90,850 |
| 2020 | $4,010 | $115,860 | $25,010 | $90,850 |
| 2019 | $3,947 | $115,860 | $25,010 | $90,850 |
| 2018 | $3,874 | $115,860 | $25,010 | $90,850 |
| 2017 | $3,801 | $115,860 | $25,010 | $90,850 |
| 2016 | $0 | $115,860 | $25,010 | $90,850 |
| 2015 | -- | $115,860 | $25,010 | $90,850 |
| 2014 | -- | $115,860 | $25,010 | $90,850 |
Source: Public Records
Map
Nearby Homes
Your Personal Tour Guide
Ask me questions while you tour the home.