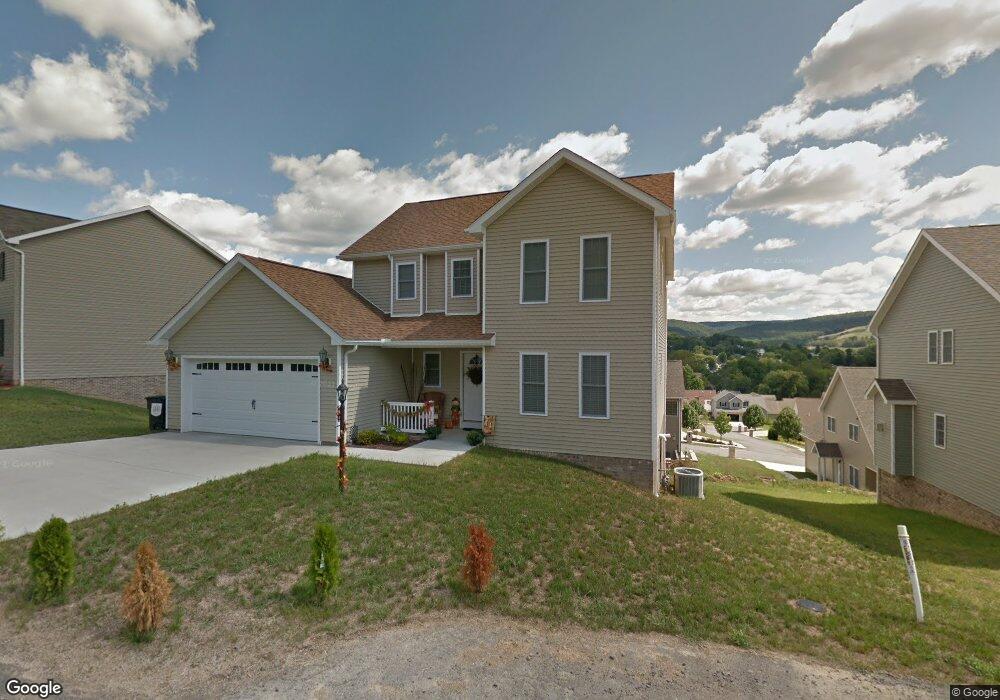
201 Piave Ln Morgantown, WV 26508
Brookhaven NeighborhoodEstimated Value: $378,435 - $416,000
3
Beds
3
Baths
2,202
Sq Ft
$180/Sq Ft
Est. Value
About This Home
This home is located at 201 Piave Ln, Morgantown, WV 26508 and is currently estimated at $395,609, approximately $179 per square foot. 201 Piave Ln is a home with nearby schools including Brookhaven Elementary School, South Middle School, and Morgantown High School.
Ownership History
Date
Name
Owned For
Owner Type
Purchase Details
Closed on
May 21, 2018
Sold by
Mcdonald Matthew L and Mcdonald Tara L
Bought by
Chen Youdi and Lin Yiduan
Current Estimated Value
Home Financials for this Owner
Home Financials are based on the most recent Mortgage that was taken out on this home.
Original Mortgage
$170,000
Outstanding Balance
$124,089
Interest Rate
4.4%
Mortgage Type
New Conventional
Estimated Equity
$271,520
Purchase Details
Closed on
May 22, 2012
Sold by
Build With Pride Inc
Bought by
Hessami Joseph H and Hessami Carolyn M
Home Financials for this Owner
Home Financials are based on the most recent Mortgage that was taken out on this home.
Original Mortgage
$261,250
Interest Rate
2.12%
Mortgage Type
Adjustable Rate Mortgage/ARM
Purchase Details
Closed on
Sep 19, 2011
Sold by
Tress Construction Llc
Bought by
Build With Pride Inc
Create a Home Valuation Report for This Property
The Home Valuation Report is an in-depth analysis detailing your home's value as well as a comparison with similar homes in the area
Home Values in the Area
Average Home Value in this Area
Purchase History
| Date | Buyer | Sale Price | Title Company |
|---|---|---|---|
| Chen Youdi | $300,000 | None Available | |
| Hessami Joseph H | $275,000 | None Available | |
| Build With Pride Inc | $36,000 | None Available |
Source: Public Records
Mortgage History
| Date | Status | Borrower | Loan Amount |
|---|---|---|---|
| Open | Chen Youdi | $170,000 | |
| Previous Owner | Hessami Joseph H | $261,250 |
Source: Public Records
Tax History Compared to Growth
Tax History
| Year | Tax Paid | Tax Assessment Tax Assessment Total Assessment is a certain percentage of the fair market value that is determined by local assessors to be the total taxable value of land and additions on the property. | Land | Improvement |
|---|---|---|---|---|
| 2024 | $1,557 | $152,890 | $26,830 | $126,060 |
| 2023 | $1,635 | $152,890 | $26,830 | $126,060 |
| 2022 | $1,556 | $151,870 | $26,830 | $125,040 |
| 2021 | $1,563 | $151,810 | $26,770 | $125,040 |
| 2020 | $1,570 | $151,810 | $26,770 | $125,040 |
| 2019 | $1,582 | $151,810 | $26,770 | $125,040 |
| 2018 | $1,587 | $151,810 | $26,770 | $125,040 |
| 2017 | $1,579 | $150,310 | $25,270 | $125,040 |
| 2016 | $1,576 | $149,100 | $24,060 | $125,040 |
| 2015 | $1,507 | $149,100 | $24,060 | $125,040 |
| 2014 | $1,243 | $128,880 | $23,100 | $105,780 |
Source: Public Records
Map
Nearby Homes
- 210 Piave Ln
- 101 Summits Ridge
- 207 Josephine Dr
- 210 Josephine Dr
- 16 Reyes Ln
- 116 Corkrean Way
- 374 Brookhaven Rd
- 118 Park Place Dr
- 3039 Earl L Core Rd
- 000 Bowers Ln
- 3392 Earl L Core Rd
- Lot 7 Brookdale Dr
- Lot 6 Ices Ferry Estates
- Lot 6 Brookdale Dr
- Lot 8 Brookdale Dr
- Lot 17 Brookdale Dr
- 22 Eastgate Dr
- 8 Summers Ridge Rd
- 12 Summers Ridge Rd
- 00 Greenbag Rd
- 199 Piave Ln
- 203 Piave Ln
- 1074 Autumn Ave
- 118 Summits Ridge
- 1072 Autumn Ave
- 116 Summits Ridge
- 1076 Autumn Ave
- 120 Summits Ridge
- 205 Piave Ln
- 197 Piave Ln
- 1070 Autumn Ave
- 114 Summits Ridge
- 122 Summits Ridge
- 119 Summits Ridge
- 207 Piave Ln
- 121 Summits Ridge
- 1071 Autumn Ave
- 1078 Autumn Ave
- 1073 Autumn Ave
- 1068 Autumn Ave