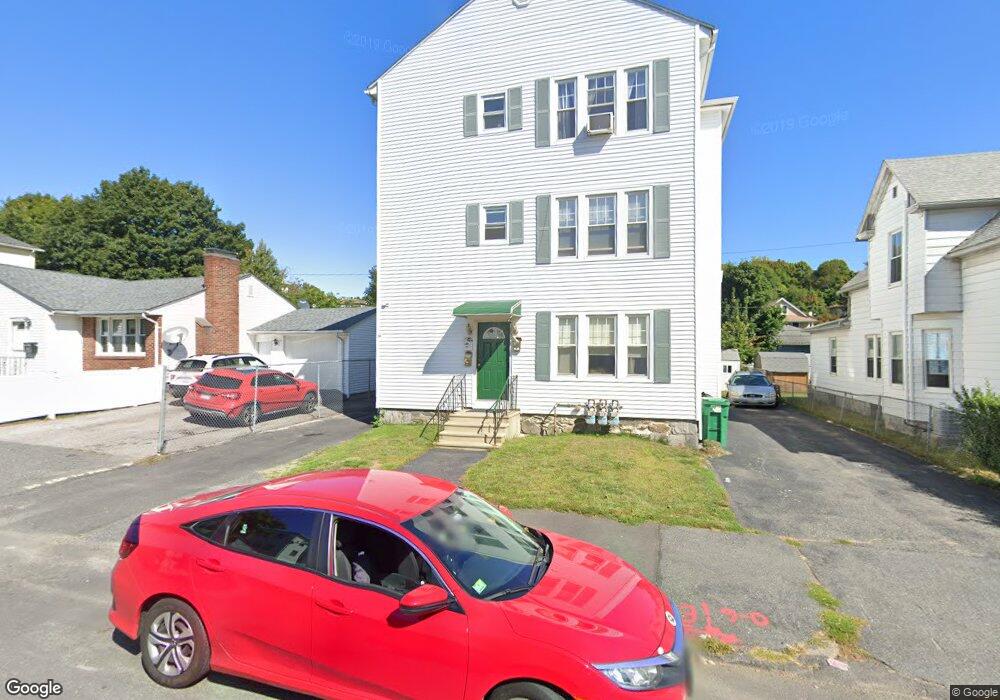
201 Pilgrim Ave Worcester, MA 01604
Grafton Hill NeighborhoodEstimated Value: $693,000 - $763,000
9
Beds
3
Baths
4,086
Sq Ft
$180/Sq Ft
Est. Value
About This Home
This home is located at 201 Pilgrim Ave, Worcester, MA 01604 and is currently estimated at $736,000, approximately $180 per square foot. 201 Pilgrim Ave is a home located in Worcester County with nearby schools including Jacob Hiatt Magnet School, Chandler Magnet, and Rice Square Elementary School.
Ownership History
Date
Name
Owned For
Owner Type
Purchase Details
Closed on
May 28, 2024
Sold by
Reeks Steven and Reeks Christopher
Bought by
Steven T Reeks Ret and Reeks
Current Estimated Value
Purchase Details
Closed on
Apr 30, 2020
Sold by
Reeks Christopher and Fernie Jennifer
Bought by
Reeks Steven and Reeks Christopher
Purchase Details
Closed on
Apr 9, 2014
Sold by
Reeks Steven
Bought by
Reeks Christopher and Ferine Jennifer
Purchase Details
Closed on
Apr 26, 2006
Sold by
Bifolck Stephanie and Reeks Stephanie
Bought by
Reeks Steven
Purchase Details
Closed on
Sep 3, 1996
Sold by
Fhlmc
Bought by
Reeks Steven T
Purchase Details
Closed on
Mar 14, 1995
Sold by
Cardoni Albert
Bought by
Fhlmc
Create a Home Valuation Report for This Property
The Home Valuation Report is an in-depth analysis detailing your home's value as well as a comparison with similar homes in the area
Home Values in the Area
Average Home Value in this Area
Purchase History
| Date | Buyer | Sale Price | Title Company |
|---|---|---|---|
| Steven T Reeks Ret | -- | None Available | |
| Steven T Reeks Ret | -- | None Available | |
| Reeks Steven | -- | None Available | |
| Reeks Christopher | -- | -- | |
| Reeks Christopher | -- | -- | |
| Reeks Steven | -- | -- | |
| Reeks Steven | -- | -- | |
| Reeks Steven T | $64,900 | -- | |
| Reeks Steven T | $64,900 | -- | |
| Fhlmc | $80,000 | -- | |
| Fhlmc | $80,000 | -- |
Source: Public Records
Mortgage History
| Date | Status | Borrower | Loan Amount |
|---|---|---|---|
| Previous Owner | Fhlmc | $30,000 | |
| Previous Owner | Fhlmc | $75,000 |
Source: Public Records
Tax History
| Year | Tax Paid | Tax Assessment Tax Assessment Total Assessment is a certain percentage of the fair market value that is determined by local assessors to be the total taxable value of land and additions on the property. | Land | Improvement |
|---|---|---|---|---|
| 2025 | $8,216 | $622,900 | $96,100 | $526,800 |
| 2024 | $7,585 | $551,600 | $96,100 | $455,500 |
| 2023 | $7,260 | $506,300 | $83,600 | $422,700 |
| 2022 | $6,317 | $415,300 | $66,900 | $348,400 |
| 2021 | $5,604 | $344,200 | $53,500 | $290,700 |
| 2020 | $5,194 | $305,500 | $53,500 | $252,000 |
| 2019 | $5,200 | $288,900 | $48,100 | $240,800 |
| 2018 | $5,083 | $268,800 | $48,100 | $220,700 |
| 2017 | $4,767 | $248,000 | $48,100 | $199,900 |
| 2016 | $4,565 | $221,500 | $35,800 | $185,700 |
| 2015 | $4,446 | $221,500 | $35,800 | $185,700 |
| 2014 | $4,328 | $221,500 | $35,800 | $185,700 |
Source: Public Records
Map
Nearby Homes
- 205 Pilgrim Ave
- 197 Pilgrim Ave
- 99 Puritan Ave
- 103 Puritan Ave
- 97 Puritan Ave
- 187 Pilgrim Ave
- 209 Pilgrim Ave
- 209 Pilgrim Ave Unit 3
- 208 Pilgrim Ave
- 208 Pilgrim Ave Unit 1
- 208 Pilgrim Ave Unit 5 & 6
- 105 Puritan Ave
- 206 Pilgrim Ave
- 95 Puritan Ave
- 210 Pilgrim Ave
- 185 Pilgrim Ave
- 196 Pilgrim Ave
- 93 Puritan Ave
- 93 Puritan Ave Unit 1
- 190 Pilgrim Ave
Your Personal Tour Guide
Ask me questions while you tour the home.