Estimated Value: $840,000 - $870,000
4
Beds
4
Baths
3,806
Sq Ft
$224/Sq Ft
Est. Value
About This Home
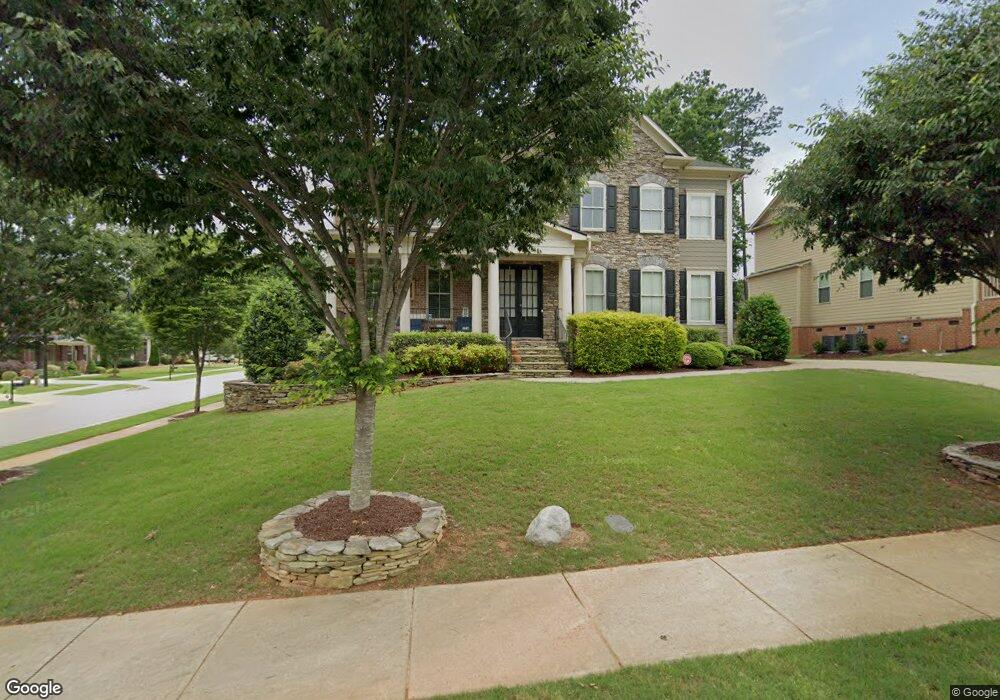
This home is located at 201 Placid Creek Ln, Apex, NC 27539 and is currently estimated at $854,168, approximately $224 per square foot. 201 Placid Creek Ln is a home located in Wake County with nearby schools including Holly Ridge Elementary School, Holly Ridge Middle School, and Holly Springs High School.
Ownership History
Date
Name
Owned For
Owner Type
Purchase Details
Closed on
Nov 24, 2020
Sold by
Scolnick Jeffrey Jay and Scolnick Shannon
Bought by
Bhandari Varun M and Bhandari Puja
Current Estimated Value
Home Financials for this Owner
Home Financials are based on the most recent Mortgage that was taken out on this home.
Original Mortgage
$491,400
Outstanding Balance
$438,273
Interest Rate
2.8%
Mortgage Type
New Conventional
Estimated Equity
$415,895
Purchase Details
Closed on
May 2, 2018
Sold by
Scolnick Jeffrey and Scolnick Shannon
Bought by
Scolnick Jeffrey Jay and Scolnick Shannon
Purchase Details
Closed on
Jul 12, 2010
Sold by
John Wieland Homes & Neighborhoods Of Th
Bought by
Scolnick Jeffrey and Scolnick Shannon
Home Financials for this Owner
Home Financials are based on the most recent Mortgage that was taken out on this home.
Original Mortgage
$205,000
Interest Rate
4.73%
Mortgage Type
New Conventional
Create a Home Valuation Report for This Property
The Home Valuation Report is an in-depth analysis detailing your home's value as well as a comparison with similar homes in the area
Home Values in the Area
Average Home Value in this Area
Purchase History
| Date | Buyer | Sale Price | Title Company |
|---|---|---|---|
| Bhandari Varun M | $546,000 | None Available | |
| Bhandari Varun M | $546,000 | Sizemore Jonathan T | |
| Scolnick Jeffrey Jay | -- | None Available | |
| Scolnick Jeffrey | $456,000 | None Available |
Source: Public Records
Mortgage History
| Date | Status | Borrower | Loan Amount |
|---|---|---|---|
| Open | Bhandari Varun M | $491,400 | |
| Closed | Bhandari Varun M | $491,400 | |
| Previous Owner | Scolnick Jeffrey | $205,000 |
Source: Public Records
Tax History Compared to Growth
Tax History
| Year | Tax Paid | Tax Assessment Tax Assessment Total Assessment is a certain percentage of the fair market value that is determined by local assessors to be the total taxable value of land and additions on the property. | Land | Improvement |
|---|---|---|---|---|
| 2025 | $6,750 | $781,976 | $120,000 | $661,976 |
| 2024 | $6,722 | $781,976 | $120,000 | $661,976 |
| 2023 | $5,543 | $512,035 | $60,000 | $452,035 |
| 2022 | $5,351 | $512,035 | $60,000 | $452,035 |
| 2021 | $5,251 | $512,035 | $60,000 | $452,035 |
| 2020 | $5,251 | $512,035 | $60,000 | $452,035 |
| 2019 | $5,347 | $442,746 | $70,000 | $372,746 |
| 2018 | $0 | $442,746 | $70,000 | $372,746 |
| 2017 | $4,658 | $442,746 | $70,000 | $372,746 |
| 2016 | $4,594 | $442,746 | $70,000 | $372,746 |
| 2015 | $4,813 | $456,697 | $90,000 | $366,697 |
| 2014 | $4,646 | $456,697 | $90,000 | $366,697 |
Source: Public Records
Map
Nearby Homes
- 200 Seagraves Creek Ln
- 204 Seagraves Creek Ln
- 201 Seagraves Creek Ln
- 132 Seagraves Creek Ln
- 124 Seagraves Creek Ln
- 120 Seagraves Creek Ln
- 113 Seagraves Creek Ln
- 103 Pleasant Glen Ln
- 114 Pleasant Glen Ln
- 120 Ransomwood Dr
- 155 Writing Rock Place
- 157 Writing Rock Place
- 5033 Sunset Lake Rd
- 100 Castien Cove Place
- 9640 Holly Springs Rd
- 108 Warm Wood Ln
- 104 Crossway Ln
- 129 Starwood Ln
- 208 Bellagio Dr
- 4313 Public Dr
- 205 Placid Creek Ln
- 205 Placid Creek Ln
- 205 Placid Creek Dr
- 201 Placid Creek Dr
- 221 Placid Creek Ln
- 104 Feathercrest Ln
- 209 Placid Creek Ln
- 212 Placid Creek Ln
- 120 Feathercrest Ln
- 209 Placid Creek Ln
- 201 Harvestwood Dr
- 116 Feathercrest Ln
- 100 Feathercrest Ln
- 209 Placid Creek Ln
- 112 Feathercrest Ln
- 200 Placid Creek Ln
- 200 Placid Creek Ln
- 205 Harvestwood Dr
- 204 Placid Creek Ln
- 108 Feathercrest Ln