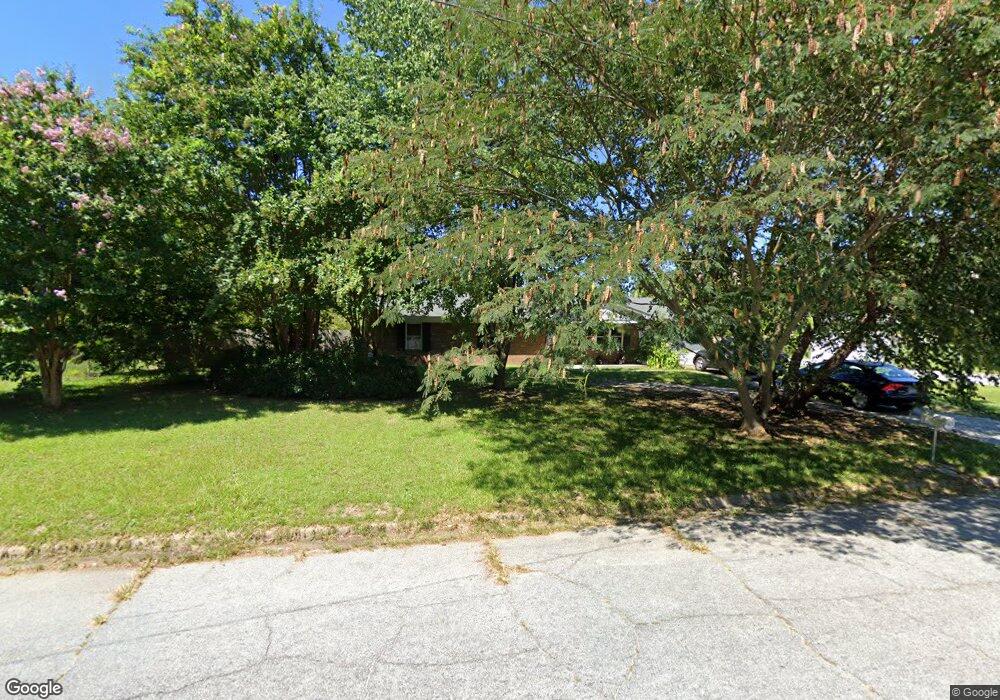
201 Plantation Rd Augusta, GA 30907
Estimated Value: $217,000 - $239,620
4
Beds
2
Baths
1,651
Sq Ft
$139/Sq Ft
Est. Value
About This Home
This home is located at 201 Plantation Rd, Augusta, GA 30907 and is currently estimated at $229,655, approximately $139 per square foot. 201 Plantation Rd is a home located in Columbia County with nearby schools including Westmont Elementary School, Columbia Middle School, and Evans High School.
Ownership History
Date
Name
Owned For
Owner Type
Purchase Details
Closed on
Sep 29, 2021
Sold by
Madden Alexandria
Bought by
Hogan Elizabeth A
Current Estimated Value
Home Financials for this Owner
Home Financials are based on the most recent Mortgage that was taken out on this home.
Original Mortgage
$196,416
Outstanding Balance
$178,724
Interest Rate
2.8%
Mortgage Type
VA
Estimated Equity
$50,931
Purchase Details
Closed on
Aug 30, 2017
Sold by
Rose Tanya Melissa
Bought by
Madden Alexandria
Home Financials for this Owner
Home Financials are based on the most recent Mortgage that was taken out on this home.
Original Mortgage
$110,000
Interest Rate
3.93%
Mortgage Type
New Conventional
Purchase Details
Closed on
Mar 10, 2006
Sold by
Tubbs Daniel P
Bought by
Rose Rodney S
Home Financials for this Owner
Home Financials are based on the most recent Mortgage that was taken out on this home.
Original Mortgage
$101,000
Interest Rate
6.19%
Mortgage Type
New Conventional
Create a Home Valuation Report for This Property
The Home Valuation Report is an in-depth analysis detailing your home's value as well as a comparison with similar homes in the area
Home Values in the Area
Average Home Value in this Area
Purchase History
| Date | Buyer | Sale Price | Title Company |
|---|---|---|---|
| Hogan Elizabeth A | $192,000 | -- | |
| Madden Alexandria | $110,000 | -- | |
| Rose Rodney S | $101,000 | -- |
Source: Public Records
Mortgage History
| Date | Status | Borrower | Loan Amount |
|---|---|---|---|
| Open | Hogan Elizabeth A | $196,416 | |
| Previous Owner | Madden Alexandria | $110,000 | |
| Previous Owner | Rose Rodney S | $101,000 |
Source: Public Records
Tax History
| Year | Tax Paid | Tax Assessment Tax Assessment Total Assessment is a certain percentage of the fair market value that is determined by local assessors to be the total taxable value of land and additions on the property. | Land | Improvement |
|---|---|---|---|---|
| 2025 | $2,277 | $93,004 | $15,104 | $77,900 |
| 2024 | $2,243 | $87,403 | $16,804 | $70,599 |
| 2023 | $2,243 | $76,758 | $15,104 | $61,654 |
| 2022 | $2,011 | $75,143 | $12,204 | $62,939 |
| 2021 | $1,551 | $56,812 | $11,204 | $45,608 |
| 2020 | $1,493 | $51,641 | $10,204 | $41,437 |
| 2019 | $1,451 | $50,119 | $9,104 | $41,015 |
| 2018 | $1,285 | $44,000 | $9,404 | $34,596 |
| 2017 | $1,373 | $46,989 | $9,604 | $37,385 |
| 2016 | $1,190 | $41,947 | $8,380 | $33,567 |
| 2015 | $1,147 | $40,277 | $7,880 | $32,397 |
| 2014 | $1,175 | $40,788 | $8,280 | $32,508 |
Source: Public Records
Map
Nearby Homes
- 4507 Colonial Rd
- 213 S Belair Rd
- 4524 Oakley Pirkle Rd
- 618 Matheny Cut
- 606 Todd Rd
- 654 Clinton Way W
- 524 Casey Ct
- 302 Laurel Place
- 4127 Meriden Dr
- 1447 Collins Dr
- 211 Kestwick Dr W
- 4572 Oakley Pirkle Rd
- 133 Highview Dr
- 706 Muscadine Ct
- 4367 Quail Creek Rd
- 351 Pellet Ct
- 233 Kestwick Dr W
- 4357 Quail Creek Rd
- 303 Meadowlake Dr
- 289 Ashbrook Dr
- 4503 Plantation Rd
- 4505 Plantation Rd
- 105 Plantation Rd
- 4507 Plantation Rd
- 228 Palmetto Dr
- 2801 Palmetto Dr
- 229 Palmetto Dr
- 4504 Plantation Rd
- 103 Plantation Rd
- 227 Palmetto Dr
- 4509 Plantation Rd
- 2802 Palmetto Dr
- 249 Merion Ct
- 226 Palmetto Dr
- 4506 Plantation Rd
- 247 Merion Ct
- 225 Palmetto Dr
- 110 Plantation Rd
- 4508 Plantation Rd
- 4511 Plantation Rd
Your Personal Tour Guide
Ask me questions while you tour the home.