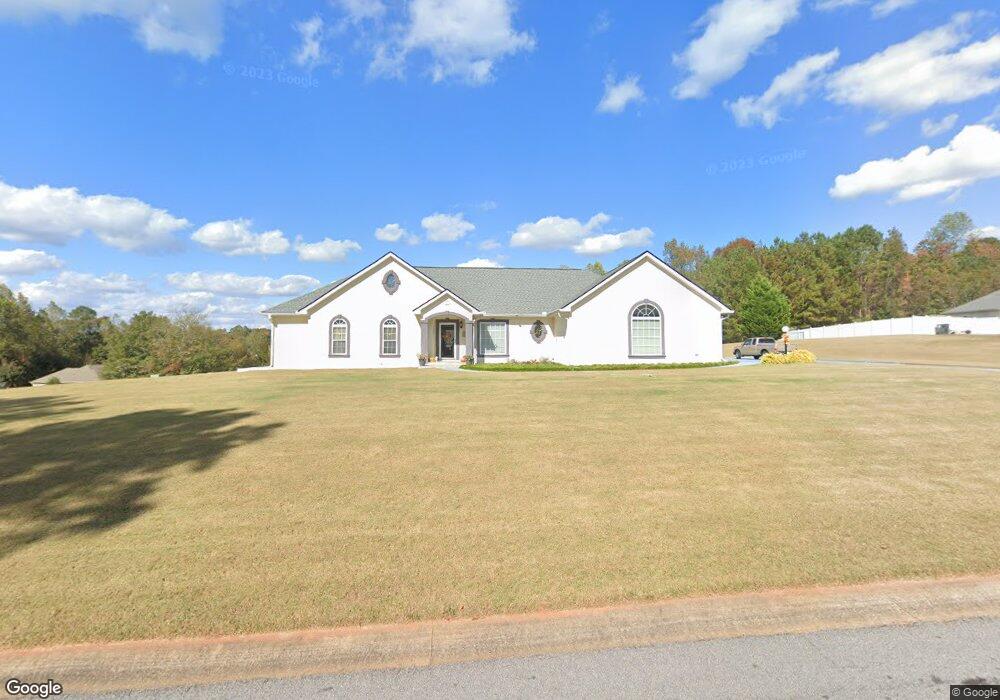
201 Planters Ridge Ct Lagrange, GA 30240
Estimated Value: $322,867 - $365,000
3
Beds
3
Baths
1,842
Sq Ft
$187/Sq Ft
Est. Value
About This Home
This home is located at 201 Planters Ridge Ct, Lagrange, GA 30240 and is currently estimated at $344,967, approximately $187 per square foot. 201 Planters Ridge Ct is a home located in Troup County with nearby schools including Berta Weathersbee Elementary School, Long Cane Elementary School, and Whitesville Road Elementary School.
Ownership History
Date
Name
Owned For
Owner Type
Purchase Details
Closed on
Feb 1, 2019
Sold by
Simons Jimmie W
Bought by
Reese Franklin U and Reese Mary S
Current Estimated Value
Purchase Details
Closed on
Mar 29, 2005
Sold by
Crawford Wanda Gail
Bought by
Simons Jimmie W and Simons Leta R
Home Financials for this Owner
Home Financials are based on the most recent Mortgage that was taken out on this home.
Original Mortgage
$125,000
Interest Rate
5.74%
Mortgage Type
New Conventional
Purchase Details
Closed on
Sep 13, 2000
Sold by
Knight Charles L
Bought by
Wanda Crawford Gail
Purchase Details
Closed on
Aug 28, 2000
Sold by
First Flag Bank
Bought by
Knight Charles L
Purchase Details
Closed on
Sep 6, 1973
Bought by
First Flag Bank
Create a Home Valuation Report for This Property
The Home Valuation Report is an in-depth analysis detailing your home's value as well as a comparison with similar homes in the area
Home Values in the Area
Average Home Value in this Area
Purchase History
| Date | Buyer | Sale Price | Title Company |
|---|---|---|---|
| Reese Franklin U | $210,000 | -- | |
| Simons Jimmie W | -- | -- | |
| Simons Jimmie W | $205,000 | -- | |
| Wanda Crawford Gail | $22,000 | -- | |
| Knight Charles L | -- | -- | |
| First Flag Bank | -- | -- |
Source: Public Records
Mortgage History
| Date | Status | Borrower | Loan Amount |
|---|---|---|---|
| Previous Owner | Simons Jimmie W | $125,000 |
Source: Public Records
Tax History Compared to Growth
Tax History
| Year | Tax Paid | Tax Assessment Tax Assessment Total Assessment is a certain percentage of the fair market value that is determined by local assessors to be the total taxable value of land and additions on the property. | Land | Improvement |
|---|---|---|---|---|
| 2024 | $2,714 | $107,320 | $14,000 | $93,320 |
| 2023 | $2,552 | $101,400 | $10,000 | $91,400 |
| 2022 | $2,508 | $97,600 | $10,000 | $87,600 |
| 2021 | $2,735 | $90,680 | $10,000 | $80,680 |
| 2020 | $2,533 | $90,680 | $10,000 | $80,680 |
| 2019 | $2,025 | $74,880 | $10,000 | $64,880 |
| 2018 | $1,846 | $68,960 | $10,000 | $58,960 |
| 2017 | $1,846 | $68,960 | $10,000 | $58,960 |
| 2016 | $1,797 | $67,319 | $10,000 | $57,319 |
| 2015 | $1,797 | $67,319 | $10,000 | $57,319 |
| 2014 | $1,617 | $61,360 | $10,000 | $51,360 |
| 2013 | -- | $63,832 | $10,000 | $53,832 |
Source: Public Records
Map
Nearby Homes
- 100 Huntcliff Ct
- 135 Planters Ridge Dr
- 124 Foxdale Dr
- 141 Plymouth Dr
- 110 Hawthorne Cir
- 190 Hill Rd
- 105 Hawthorne Cir
- 103 Hawthorne Cir
- 119 Plymouth Dr
- 102 Franklin Place
- 0 Deming St Unit 10550189
- 101 Ivy Springs Dr
- 474 Newton Rd
- 40 River Point Dr
- 509 Connie Dr
- 709 Vernon Ferry Rd
- 205 Linda Ln
- LOT 4 Angela Dr
- 808 S Fling Rd
- E Angela Dr
- 108 Planters Ridge Dr
- 203 Planters Ridge Ct
- 102 Planters Ridge Dr
- 110 Planters Ridge Dr
- 107 Planters Ridge Dr
- 107 Planters Ridge
- 205 Planters Ridge Ct
- 109 Planters Ridge Dr
- 204 Planters Ridge Ct
- 0 Blackberry Ct Unit 7033823
- 0 Blackberry Ct Unit 7247477
- 0 Blackberry Ct Unit 3075800
- 0 Blackberry Ct Unit 3075236
- 0 Blackberry Ct
- 202 Blackberry Ct
- 100 Planters Ridge Dr
- 202 Planters Ridge Ct
- 111 Planters Ridge Dr
- 103 Planters Ridge Dr
- 200 Blackberry Ct