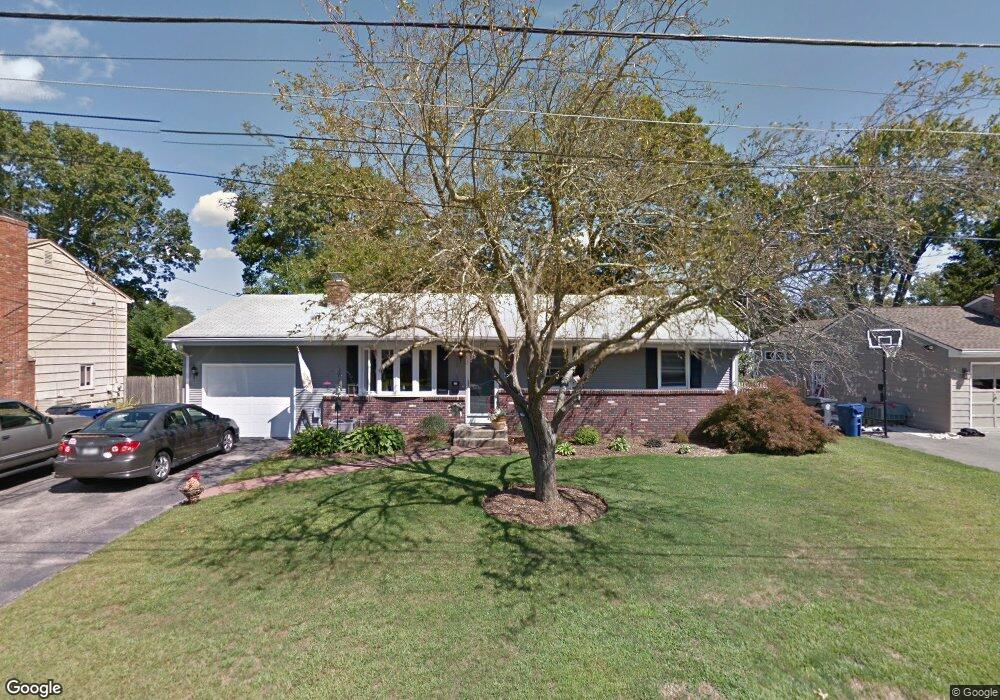
201 Potters Ave Warwick, RI 02886
Greenwood NeighborhoodEstimated Value: $480,000 - $675,000
3
Beds
3
Baths
1,890
Sq Ft
$281/Sq Ft
Est. Value
About This Home
This home is located at 201 Potters Ave, Warwick, RI 02886 and is currently estimated at $530,200, approximately $280 per square foot. 201 Potters Ave is a home located in Kent County with nearby schools including St Rose Of Lima School, Islamic School of Rhode Island, and St Joseph School.
Ownership History
Date
Name
Owned For
Owner Type
Purchase Details
Closed on
Nov 20, 2020
Sold by
Desimone Holly and Desimone Robert A
Bought by
Desimone Holly
Current Estimated Value
Home Financials for this Owner
Home Financials are based on the most recent Mortgage that was taken out on this home.
Original Mortgage
$234,000
Outstanding Balance
$185,466
Interest Rate
2.8%
Mortgage Type
New Conventional
Estimated Equity
$344,734
Purchase Details
Closed on
Jun 12, 2009
Sold by
Meyer Sherry L
Bought by
Desimone Holly and Desimone Robert A
Home Financials for this Owner
Home Financials are based on the most recent Mortgage that was taken out on this home.
Original Mortgage
$283,765
Interest Rate
4.82%
Mortgage Type
Purchase Money Mortgage
Purchase Details
Closed on
Nov 19, 2002
Sold by
Lapin Joseph B
Bought by
Meyer Sherry L
Create a Home Valuation Report for This Property
The Home Valuation Report is an in-depth analysis detailing your home's value as well as a comparison with similar homes in the area
Home Values in the Area
Average Home Value in this Area
Purchase History
| Date | Buyer | Sale Price | Title Company |
|---|---|---|---|
| Desimone Holly | -- | None Available | |
| Desimone Holly | $289,000 | -- | |
| Meyer Sherry L | $175,000 | -- |
Source: Public Records
Mortgage History
| Date | Status | Borrower | Loan Amount |
|---|---|---|---|
| Open | Desimone Holly | $234,000 | |
| Previous Owner | Meyer Sherry L | $273,436 | |
| Previous Owner | Meyer Sherry L | $283,765 | |
| Previous Owner | Meyer Sherry L | $60,000 |
Source: Public Records
Tax History
| Year | Tax Paid | Tax Assessment Tax Assessment Total Assessment is a certain percentage of the fair market value that is determined by local assessors to be the total taxable value of land and additions on the property. | Land | Improvement |
|---|---|---|---|---|
| 2025 | $5,648 | $444,700 | $138,800 | $305,900 |
| 2024 | $5,315 | $367,300 | $120,600 | $246,700 |
| 2023 | $5,212 | $367,300 | $120,600 | $246,700 |
| 2022 | $5,267 | $281,200 | $96,700 | $184,500 |
| 2021 | $5,267 | $281,200 | $96,700 | $184,500 |
| 2020 | $5,267 | $281,200 | $96,700 | $184,500 |
| 2019 | $5,267 | $281,200 | $96,700 | $184,500 |
| 2018 | $4,649 | $223,500 | $90,000 | $133,500 |
| 2017 | $4,524 | $223,500 | $90,000 | $133,500 |
| 2016 | $4,524 | $223,500 | $90,000 | $133,500 |
| 2015 | $4,111 | $198,100 | $80,400 | $117,700 |
| 2014 | $3,974 | $198,100 | $80,400 | $117,700 |
| 2013 | $3,920 | $198,100 | $80,400 | $117,700 |
Source: Public Records
Map
Nearby Homes
- 333 Greenwood Ave
- 6 Lillian Ct
- 2907 Post Rd Unit 4
- 2907 Post Rd Unit 2
- 2907 Post Rd Unit 3
- 833 Halifax Dr
- 69 Haverhill Ave
- 27 Great Oak Dr
- 36 Great Oak Dr
- 157 George Arden Ave
- 816 Williamsbug Cir Unit 816
- 892 Halifax Dr
- 139 Lancaster Ave
- 122 Edaville Ct
- 5 Barre Ct
- 233 Palace Ave
- 143 Morse Ave
- 84 Spruce St
- 123 Edman St
- 115 Edman St
- 191 Potters Ave
- 211 Potters Ave
- 0 Potters Ave
- 202 Greenwood Ave
- 192 Greenwood Ave
- 210 Potters Ave
- 200 Potters Ave
- 179 Potters Ave
- 184 Greenwood Ave
- 221 Potters Ave
- 190 Potters Ave
- 220 Greenwood Ave
- 178 Greenwood Ave
- 180 Potters Ave
- 222 Potters Ave
- 201 Greenwood Ave
- 193 Natick Ave
- 227 Potters Ave
- 205 Greenwood Ave
- 189 Natick Ave
Your Personal Tour Guide
Ask me questions while you tour the home.