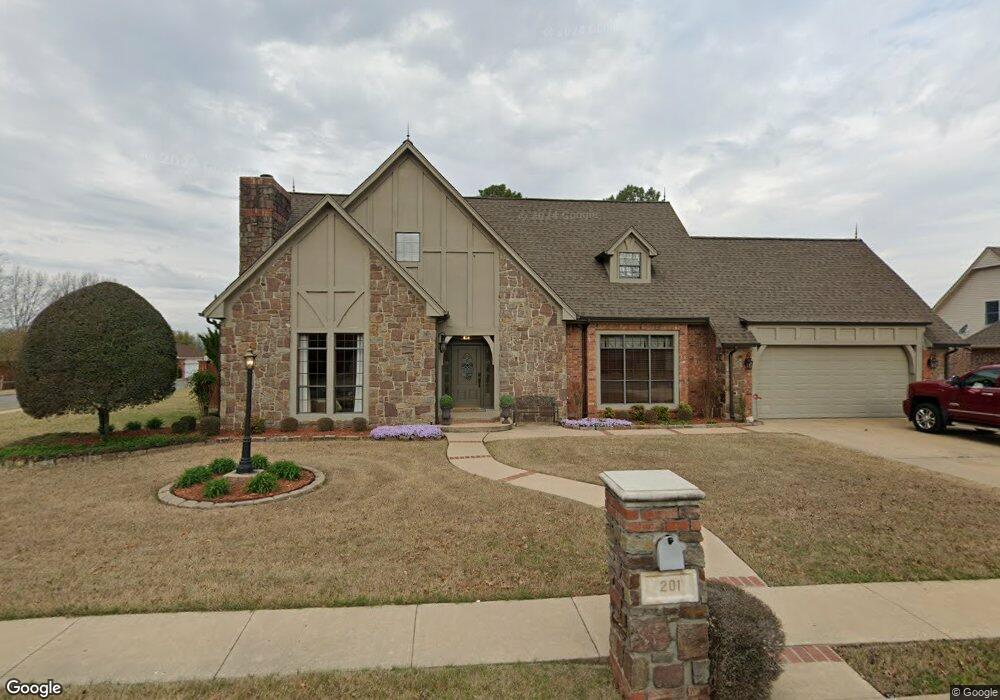
201 Remington Place Tahlequah, OK 74464
Estimated Value: $340,000 - $622,253
3
Beds
3
Baths
2,455
Sq Ft
$198/Sq Ft
Est. Value
About This Home
This home is located at 201 Remington Place, Tahlequah, OK 74464 and is currently estimated at $485,813, approximately $197 per square foot. 201 Remington Place is a home located in Cherokee County with nearby schools including Greenwood Elementary School, Cherokee Elementary School, and Tahlequah Middle School.
Ownership History
Date
Name
Owned For
Owner Type
Purchase Details
Closed on
Jul 26, 2024
Sold by
Hance Neil and Hance Janet
Bought by
Brandi Lea Barnett Revocable Trust
Current Estimated Value
Purchase Details
Closed on
Sep 6, 2022
Sold by
Gandhi Rupam I and Gandhi Pinky
Bought by
Carter Hance Neil and Hance Janet K
Home Financials for this Owner
Home Financials are based on the most recent Mortgage that was taken out on this home.
Original Mortgage
$281,250
Interest Rate
5.55%
Mortgage Type
Construction
Purchase Details
Closed on
Aug 16, 2019
Sold by
Cornell Samuel and Cornell Amber
Bought by
Hance Neil and Hance Janet
Create a Home Valuation Report for This Property
The Home Valuation Report is an in-depth analysis detailing your home's value as well as a comparison with similar homes in the area
Home Values in the Area
Average Home Value in this Area
Purchase History
| Date | Buyer | Sale Price | Title Company |
|---|---|---|---|
| Brandi Lea Barnett Revocable Trust | $590,000 | Infinity Title | |
| Carter Hance Neil | $375,000 | Infinity Title | |
| Hance Neil | -- | None Available |
Source: Public Records
Mortgage History
| Date | Status | Borrower | Loan Amount |
|---|---|---|---|
| Previous Owner | Carter Hance Neil | $281,250 |
Source: Public Records
Tax History Compared to Growth
Tax History
| Year | Tax Paid | Tax Assessment Tax Assessment Total Assessment is a certain percentage of the fair market value that is determined by local assessors to be the total taxable value of land and additions on the property. | Land | Improvement |
|---|---|---|---|---|
| 2025 | $2,690 | $64,900 | $4,400 | $60,500 |
| 2024 | $2,690 | $28,387 | $2,388 | $25,999 |
| 2023 | $2,690 | $27,035 | $2,200 | $24,835 |
| 2022 | $2,389 | $25,748 | $2,200 | $23,548 |
| 2021 | $2,283 | $24,522 | $2,200 | $22,322 |
| 2020 | $2,214 | $23,355 | $2,200 | $21,155 |
| 2019 | $2,090 | $22,242 | $2,200 | $20,042 |
| 2018 | $2,207 | $23,215 | $2,200 | $21,015 |
| 2017 | $2,203 | $23,215 | $2,200 | $21,015 |
| 2016 | $2,202 | $23,064 | $1,951 | $21,113 |
| 2015 | $1,969 | $21,966 | $2,115 | $19,851 |
| 2014 | $1,969 | $20,920 | $1,485 | $19,435 |
Source: Public Records
Map
Nearby Homes
- 103 S Harrison Ave
- 101 S Harrison Ave
- 200 Remington Place
- 111 N Logan Dr
- 0 S Hwy 82 A Hwy Unit 2532332
- 104 Tommye Ln
- 619 E Cherrie St
- 508 Garden Rd
- 204 Woodhaven Ave
- 1025 E Downing St
- 609 E Ward St
- 605 E Ward St
- 605 S Oak Ave
- 215 S Maple Ave
- 508 Covington Place
- 640 N Oklahoma Ave
- 720 S East Ave
- 403 S Bluff Ave
- 710 Victor St
- 717 N Oklahoma Ave
- 205 Remington Place
- 111 S Harrison Ave
- 111 Remington Place
- 201 S Harrison Ave
- 112 Remington Place
- 202 Remington Place
- 113 S Harrison Ave
- 109 Remington Place
- 110 Remington Place
- 204 Remington Place
- 203 S Harrison Ave
- 108 Remington Place
- 110 S Harrison Ave
- 107 Remington Place
- 112 S Harrison Ave
- 209 Remington Place
- 205 S Harrison Ave
- 104 S Harrison Ave
- 200 Greentree Dr
- 211 Remington Place