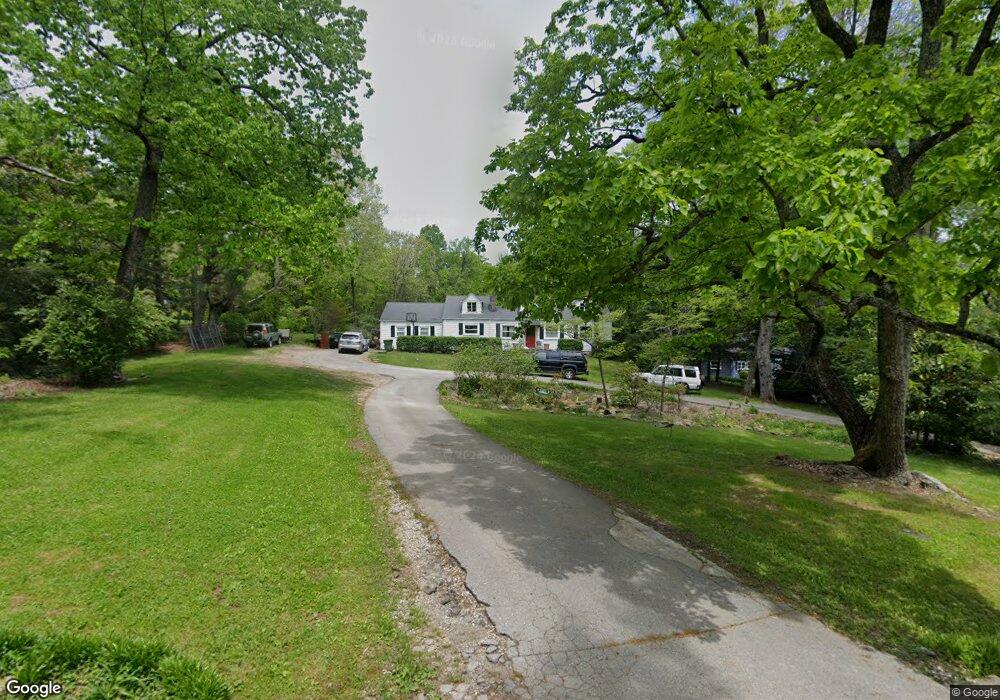
201 Robin Hood Trail Lookout Mountain, GA 30750
Estimated Value: $576,996 - $698,000
4
Beds
3
Baths
2,490
Sq Ft
$259/Sq Ft
Est. Value
About This Home
This home is located at 201 Robin Hood Trail, Lookout Mountain, GA 30750 and is currently estimated at $643,999, approximately $258 per square foot. 201 Robin Hood Trail is a home located in Walker County with nearby schools including Fairyland Elementary School, Chattanooga Valley Middle School, and Ridgeland High School.
Ownership History
Date
Name
Owned For
Owner Type
Purchase Details
Closed on
Nov 30, 2005
Sold by
Not Provided
Bought by
Burnette H Eric and Burnette Susan G
Current Estimated Value
Home Financials for this Owner
Home Financials are based on the most recent Mortgage that was taken out on this home.
Original Mortgage
$213,650
Outstanding Balance
$119,112
Interest Rate
6.23%
Mortgage Type
New Conventional
Estimated Equity
$524,887
Purchase Details
Closed on
Nov 17, 1998
Sold by
Huckabay Huckabay C and Huckabay Shelley
Bought by
Johnston Hampton L
Purchase Details
Closed on
Jun 2, 1990
Sold by
Montague Joy H
Bought by
Huckabay Huckabay C and Huckabay Shelley
Purchase Details
Closed on
Sep 19, 1988
Sold by
Thomas B Hooker
Bought by
Montague Joy H
Purchase Details
Closed on
Jan 1, 1972
Bought by
Thomas B Hooker
Create a Home Valuation Report for This Property
The Home Valuation Report is an in-depth analysis detailing your home's value as well as a comparison with similar homes in the area
Home Values in the Area
Average Home Value in this Area
Purchase History
| Date | Buyer | Sale Price | Title Company |
|---|---|---|---|
| Burnette H Eric | $267,100 | -- | |
| Johnston Hampton L | $158,000 | -- | |
| Huckabay Huckabay C | -- | -- | |
| Montague Joy H | $67,500 | -- | |
| Thomas B Hooker | -- | -- |
Source: Public Records
Mortgage History
| Date | Status | Borrower | Loan Amount |
|---|---|---|---|
| Open | Burnette H Eric | $213,650 | |
| Closed | Burnette H Eric | $53,450 |
Source: Public Records
Tax History Compared to Growth
Tax History
| Year | Tax Paid | Tax Assessment Tax Assessment Total Assessment is a certain percentage of the fair market value that is determined by local assessors to be the total taxable value of land and additions on the property. | Land | Improvement |
|---|---|---|---|---|
| 2024 | $5,651 | $184,642 | $49,314 | $135,328 |
| 2023 | $5,478 | $177,442 | $49,314 | $128,128 |
| 2022 | $3,330 | $128,510 | $32,054 | $96,456 |
| 2021 | $3,226 | $111,842 | $32,054 | $79,788 |
| 2020 | $2,810 | $93,590 | $32,054 | $61,536 |
| 2019 | $2,812 | $93,590 | $32,054 | $61,536 |
| 2018 | $2,784 | $93,590 | $32,054 | $61,536 |
| 2017 | $3,053 | $93,590 | $32,054 | $61,536 |
| 2016 | $2,525 | $93,590 | $32,054 | $61,536 |
| 2015 | $2,427 | $85,883 | $31,740 | $54,143 |
| 2014 | $2,337 | $85,883 | $31,740 | $54,143 |
| 2013 | -- | $85,882 | $31,740 | $54,142 |
Source: Public Records
Map
Nearby Homes
- 891 Fleetwood Dr
- 0 Fleetwood Dr Unit RTC2957879
- 0 Fleetwood Dr Unit 1517351
- 0 Tinker Bell Cir Unit LOT 27 10563269
- 0 Tinker Bell Cir Unit 1510010
- 219 Gnome Trail
- 504 Fleetwood Dr
- 1211 Cinderella Rd
- 1300 Elfin Rd
- 1007 Evanwood Dr
- 1212 Cinderella Rd
- 196 Fort Stephenson Place
- 302 Mcfarland Rd
- 118 Fleetwood Dr
- 401 Mcfarland Rd
- 105 N Forrest Ave
- 307 Park Rd
- 202 Prospect Way
- 5601 Alabama Ave
- 5720 Saint Elmo Ave
- 201 Robinhood Trail
- 201 Robinhood Trail
- 205 Robin Hood Trail
- 205 Robin Hood Trail
- 200 Robinhood Trail
- 200 Robin Hood Trail
- 110 Robinhood Trail
- 110 Robin Hood Trail
- 110 Robin Hood Trail
- 202 Robinhood Trail
- 107 Robin Hood Tr
- 108 Robinhood Trail
- 204 Robinhood Trail
- 204 Robin Hood Trail
- 204 Robin Hood Tr
- 105 Robin Hood Trail
- 106 Robinhood Trail
- 206 Robinhood Trail
- 206 Robin Hood Trail
- 106 Robin Hood Tr