Estimated Value: $91,438 - $165,000
--
Bed
1
Bath
921
Sq Ft
$146/Sq Ft
Est. Value
About This Home
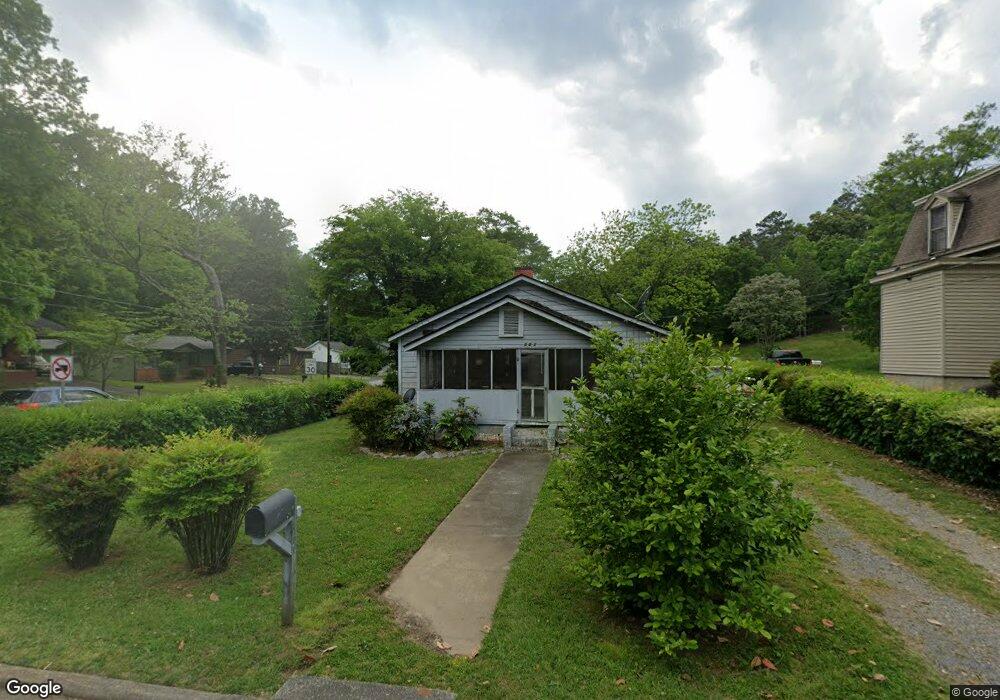
This home is located at 201 Ross St NE, Rome, GA 30161 and is currently estimated at $134,610, approximately $146 per square foot. 201 Ross St NE is a home located in Floyd County with nearby schools including Rome High School, St. Mary School, and Unity Christian School.
Ownership History
Date
Name
Owned For
Owner Type
Purchase Details
Closed on
Apr 18, 2000
Sold by
Jordan Idus
Bought by
Montgomery Rosa R
Current Estimated Value
Purchase Details
Closed on
Feb 18, 1993
Sold by
Jordan Jane Jenkins and Idus Jordan
Bought by
Jordan Idus
Purchase Details
Closed on
Jan 1, 1986
Sold by
Keys Sarah B Int and Jane Jenkins Jord
Bought by
Jordan Jane Jenkins and Idus Jordan
Purchase Details
Closed on
Nov 3, 1981
Sold by
Keys Marcus A Int and Jane Jenkins Jor
Bought by
Keys Sarah B Int and Jane Jenkins
Purchase Details
Closed on
Jan 9, 1981
Sold by
Keys Marcus A and Keys Sara B
Bought by
Keys Marcus A Int and Jane Jenkin
Purchase Details
Closed on
Jan 7, 1976
Sold by
Keys Marcus A
Bought by
Keys Marcus A and Keys Sara B
Purchase Details
Closed on
Jan 3, 1975
Bought by
P and R
Purchase Details
Closed on
Jan 2, 1975
Bought by
P and R
Purchase Details
Closed on
Jan 1, 1975
Sold by
Keys Mamie Smith
Bought by
Keys Marcus A
Purchase Details
Closed on
Jan 1, 1901
Bought by
Keys Mamie Smith
Create a Home Valuation Report for This Property
The Home Valuation Report is an in-depth analysis detailing your home's value as well as a comparison with similar homes in the area
Home Values in the Area
Average Home Value in this Area
Purchase History
| Date | Buyer | Sale Price | Title Company |
|---|---|---|---|
| Montgomery Rosa R | -- | -- | |
| Jordan Idus | -- | -- | |
| Jordan Jane Jenkins | -- | -- | |
| Keys Sarah B Int | -- | -- | |
| Keys Marcus A Int | $3,400 | -- | |
| Keys Marcus A | -- | -- | |
| P | -- | -- | |
| P | -- | -- | |
| Keys Marcus A | $1,500 | -- | |
| Keys Mamie Smith | -- | -- |
Source: Public Records
Tax History Compared to Growth
Tax History
| Year | Tax Paid | Tax Assessment Tax Assessment Total Assessment is a certain percentage of the fair market value that is determined by local assessors to be the total taxable value of land and additions on the property. | Land | Improvement |
|---|---|---|---|---|
| 2024 | $1,152 | $29,623 | $4,174 | $25,449 |
| 2023 | $1,049 | $28,055 | $3,683 | $24,372 |
| 2022 | $601 | $16,462 | $2,946 | $13,516 |
| 2021 | $507 | $13,675 | $2,946 | $10,729 |
| 2020 | $460 | $12,300 | $2,210 | $10,090 |
| 2019 | $432 | $11,675 | $2,210 | $9,465 |
| 2018 | $409 | $11,036 | $2,210 | $8,826 |
| 2017 | $394 | $10,653 | $2,210 | $8,443 |
| 2016 | $386 | $10,384 | $2,200 | $8,184 |
| 2015 | $357 | $10,167 | $2,200 | $7,967 |
| 2014 | $357 | $10,167 | $2,200 | $7,967 |
Source: Public Records
Map
Nearby Homes
- 31 Ross St NE
- 106 Ross St NE
- 15 Heard St
- 13 Heard St NE
- 1208 N Broad St NE
- 117 Jackson St NE
- 119 Jackson St NE
- 110 Smith St NE
- 303 Grady Ave NE
- 102 Smith St NE
- 3 Forsyth St NE
- 325 Ross St NE
- 1 Wright St NE
- 3 Roseway Cir NE
- 5 Roseway Cir NE
- 302 W Callahan St NE
- 15 Roseway Cir NE
- 105 E Callahan St NE
- 163 Sweet Water Lane Dr SE
- 20 Lindberg Dr NE
- 203 Ross St NE
- 326 Reservoir St NE
- 202 Ross St NE
- 202 Ross St NE
- 205 Ross St NE
- 324 Reservoir St NE
- 204 Ross St NE
- 322 Reservoir St NE
- 206 Ross St NE
- 207 Ross St NE
- 122 Ross St NE
- 29 Harvey St Unit A
- 29 Harvey St
- 318 Reservoir St NE
- 209 Ross St NE
- 27 Harvey St NE
- 101 Harvey St NE
- 33 Heard St NE
- 117 Ross St NE
- 117 Ross St NE