Estimated Value: $159,796 - $223,000
3
Beds
1
Bath
1,050
Sq Ft
$189/Sq Ft
Est. Value
About This Home
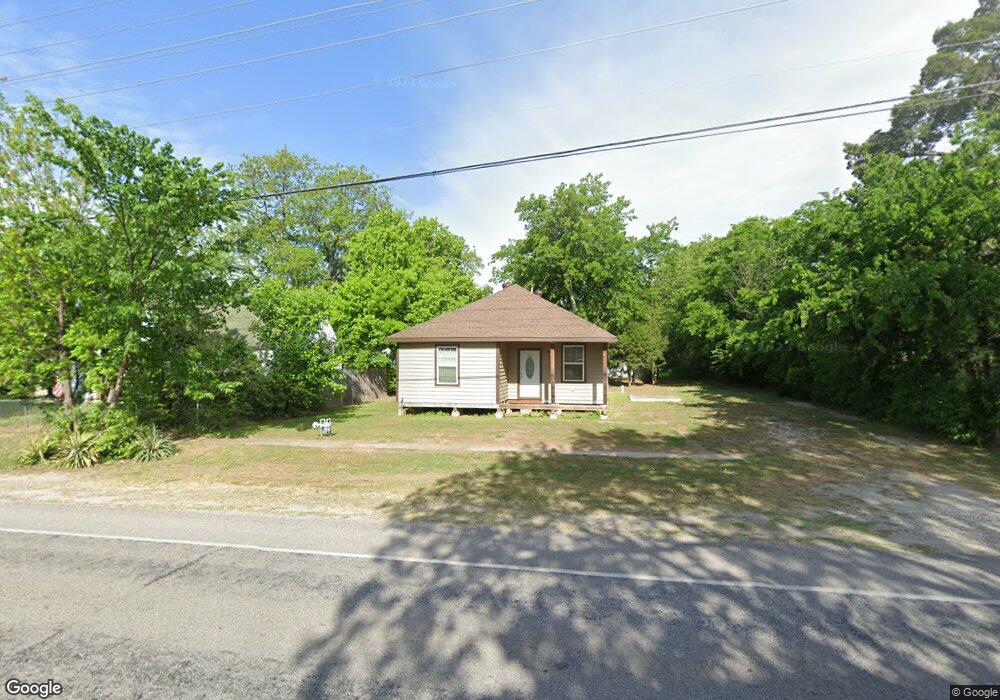
This home is located at 201 S 1st St, Krum, TX 76249 and is currently estimated at $198,449, approximately $188 per square foot. 201 S 1st St is a home located in Denton County with nearby schools including Krum Early Education Center, Dyer Elementary School, and Krum Middle School.
Ownership History
Date
Name
Owned For
Owner Type
Purchase Details
Closed on
Apr 2, 2025
Sold by
D-Berry Enterprises and Derryberry Barbara
Bought by
Marquis Investment Properties Llc
Current Estimated Value
Purchase Details
Closed on
Mar 25, 2016
Sold by
Jochetz C Michael and Jochetz Shannon D
Bought by
D Berry Enterprises
Purchase Details
Closed on
Oct 27, 1993
Sold by
Herring Roy
Bought by
Underhill Freddie and Underhill Denise
Home Financials for this Owner
Home Financials are based on the most recent Mortgage that was taken out on this home.
Original Mortgage
$35,000
Interest Rate
6.96%
Mortgage Type
Seller Take Back
Create a Home Valuation Report for This Property
The Home Valuation Report is an in-depth analysis detailing your home's value as well as a comparison with similar homes in the area
Home Values in the Area
Average Home Value in this Area
Purchase History
| Date | Buyer | Sale Price | Title Company |
|---|---|---|---|
| Marquis Investment Properties Llc | -- | Title Resources | |
| D Berry Enterprises | -- | Stewart | |
| Underhill Freddie | -- | -- | |
| Underhill Freddie | -- | -- |
Source: Public Records
Mortgage History
| Date | Status | Borrower | Loan Amount |
|---|---|---|---|
| Previous Owner | Underhill Freddie | $35,000 |
Source: Public Records
Tax History
| Year | Tax Paid | Tax Assessment Tax Assessment Total Assessment is a certain percentage of the fair market value that is determined by local assessors to be the total taxable value of land and additions on the property. | Land | Improvement |
|---|---|---|---|---|
| 2025 | $2,446 | $97,575 | $38,500 | $59,075 |
| 2024 | $2,446 | $121,390 | $38,500 | $82,890 |
| 2023 | $2,217 | $109,819 | $38,500 | $71,319 |
| 2022 | $2,383 | $103,893 | $29,150 | $74,743 |
| 2021 | $1,944 | $87,653 | $23,100 | $64,553 |
| 2020 | $1,923 | $84,922 | $23,100 | $61,822 |
| 2019 | $2,032 | $84,188 | $23,100 | $61,088 |
| 2018 | $1,702 | $70,169 | $23,100 | $47,069 |
| 2017 | $1,516 | $62,230 | $17,600 | $44,630 |
| 2016 | $1,317 | $54,049 | $17,600 | $36,449 |
| 2015 | -- | $53,284 | $17,600 | $35,684 |
| 2013 | -- | $45,344 | $17,600 | $27,744 |
Source: Public Records
Map
Nearby Homes
- 210 S 1st St
- 218 W Jones St
- 200 S 1st St
- 209 W Britton St
- 241 S 1st St
- 202 S 1st St
- 226 W Jones St
- 141 W Britton St
- 302 S 1st St
- 126 W Jones St
- 217 W Jones St
- 241 W Britton St
- 133 W Britton St Unit 206
- 301 S 1st St
- 242 W Jones St
- 118 W Jones St
- 115 W Britton St
- 115 W Britton St
- 309 S 1st St
- 303 S 2nd St
Your Personal Tour Guide
Ask me questions while you tour the home.