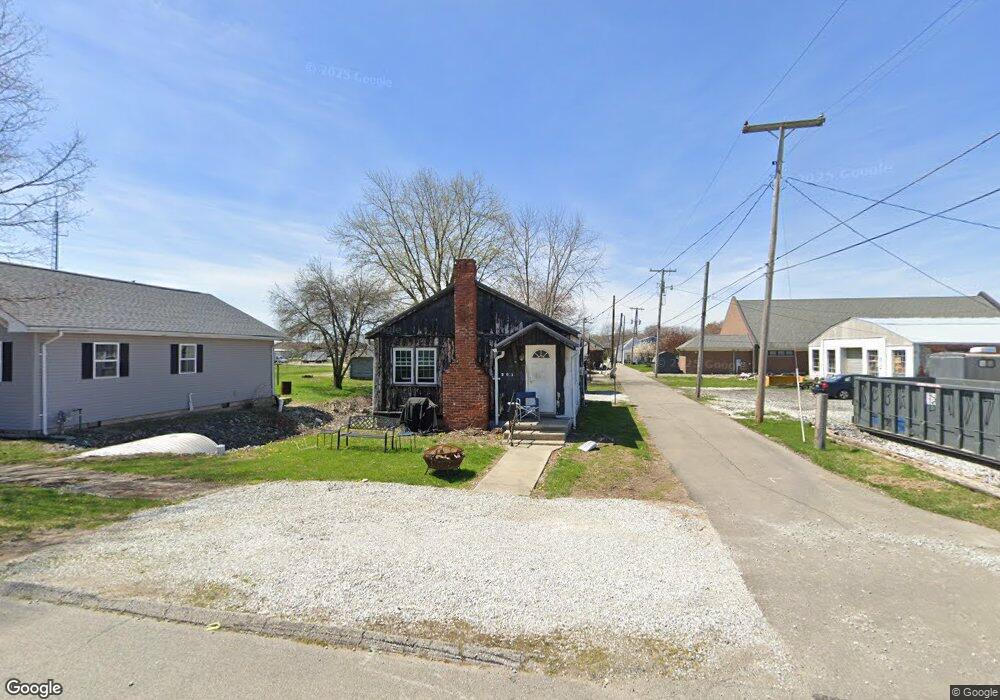
201 S John St Frankton, IN 46044
Estimated Value: $87,400 - $148,000
2
Beds
1
Bath
632
Sq Ft
$173/Sq Ft
Est. Value
About This Home
This home is located at 201 S John St, Frankton, IN 46044 and is currently estimated at $109,350, approximately $173 per square foot. 201 S John St is a home with nearby schools including Frankton Elementary School and Frankton Junior/Senior High School.
Ownership History
Date
Name
Owned For
Owner Type
Purchase Details
Closed on
Sep 28, 2018
Sold by
Mills Rastetter Holding Llc
Bought by
Mills Scott
Current Estimated Value
Purchase Details
Closed on
Dec 9, 2016
Sold by
Rastetter Matthew W
Bought by
Mills Rastetter Holding Llc
Purchase Details
Closed on
Nov 16, 2011
Sold by
Myers George G and Myers Wanda J
Bought by
Kinnett William and Kinnett Christie M
Create a Home Valuation Report for This Property
The Home Valuation Report is an in-depth analysis detailing your home's value as well as a comparison with similar homes in the area
Home Values in the Area
Average Home Value in this Area
Purchase History
| Date | Buyer | Sale Price | Title Company |
|---|---|---|---|
| Mills Scott | -- | None Available | |
| Mills Rastetter Holding Llc | -- | -- | |
| Rastetter Matthew W | -- | -- | |
| Kinnett William | -- | None Available |
Source: Public Records
Tax History Compared to Growth
Tax History
| Year | Tax Paid | Tax Assessment Tax Assessment Total Assessment is a certain percentage of the fair market value that is determined by local assessors to be the total taxable value of land and additions on the property. | Land | Improvement |
|---|---|---|---|---|
| 2024 | $796 | $39,800 | $10,000 | $29,800 |
| 2023 | $730 | $36,500 | $9,500 | $27,000 |
| 2022 | $730 | $36,500 | $9,500 | $27,000 |
| 2021 | $684 | $34,200 | $9,500 | $24,700 |
| 2020 | $684 | $34,200 | $9,500 | $24,700 |
| 2019 | $670 | $33,500 | $9,500 | $24,000 |
| 2018 | $664 | $31,800 | $9,500 | $22,300 |
| 2017 | $633 | $31,500 | $9,500 | $22,000 |
| 2016 | $658 | $31,500 | $9,500 | $22,000 |
| 2014 | $331 | $39,400 | $9,100 | $30,300 |
| 2013 | $331 | $39,400 | $9,100 | $30,300 |
Source: Public Records
Map
Nearby Homes
- 410 E Plum St
- 306 W Clyde St
- 201 W Plum St
- 503 E Clyde St
- 712 E Maple St
- 5807 W 850 N
- 0 N 600 W
- 3800 W State Road 128
- 10370 N 550 W
- 8289 W County Road 600 N
- 8289 W 600 N
- 0 900 W
- 10296 N State Road 13
- 2019 S Sheridan St
- 1230 S 25th St
- 9080 W Forest Dr
- 1218 S 24th St
- 5800 S State Rd 37
- 1800 S R St
- 0 Indiana 13