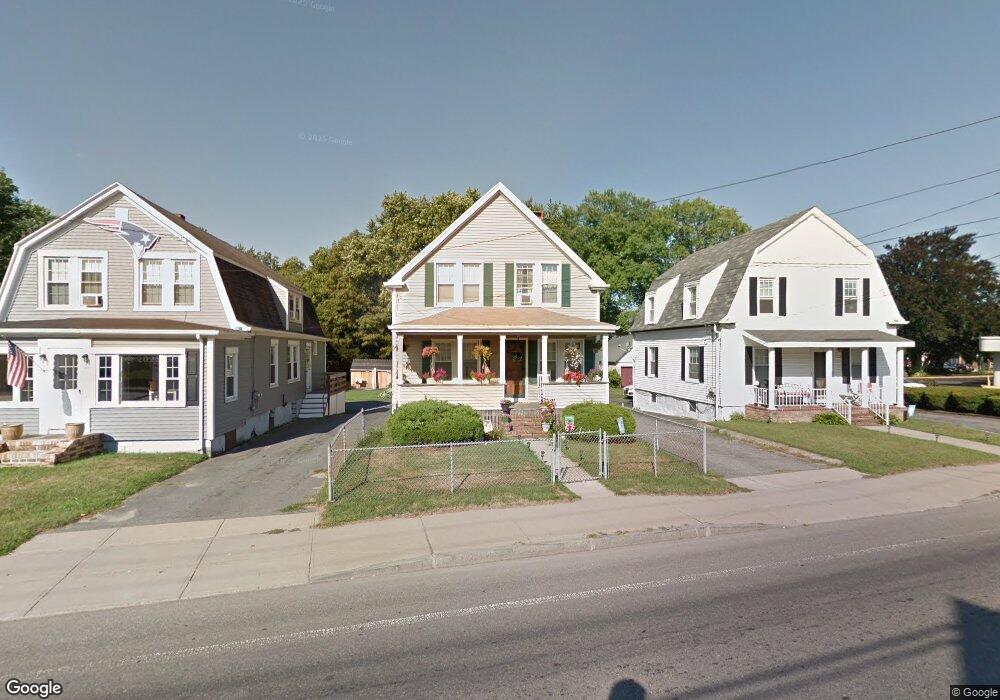
201 S Main St Acushnet, MA 02743
Estimated Value: $406,000 - $444,000
4
Beds
1
Bath
1,679
Sq Ft
$253/Sq Ft
Est. Value
About This Home
This home is located at 201 S Main St, Acushnet, MA 02743 and is currently estimated at $425,565, approximately $253 per square foot. 201 S Main St is a home located in Bristol County with nearby schools including Acushnet Elementary School, Albert F Ford Middle School, and Alma Del Mar Charter School.
Ownership History
Date
Name
Owned For
Owner Type
Purchase Details
Closed on
Jan 23, 2006
Sold by
Chase Janele S
Bought by
Lewis Anna S and Lewis Jack M
Current Estimated Value
Home Financials for this Owner
Home Financials are based on the most recent Mortgage that was taken out on this home.
Original Mortgage
$182,000
Interest Rate
6.33%
Mortgage Type
Purchase Money Mortgage
Create a Home Valuation Report for This Property
The Home Valuation Report is an in-depth analysis detailing your home's value as well as a comparison with similar homes in the area
Home Values in the Area
Average Home Value in this Area
Purchase History
| Date | Buyer | Sale Price | Title Company |
|---|---|---|---|
| Lewis Anna S | $260,000 | -- |
Source: Public Records
Mortgage History
| Date | Status | Borrower | Loan Amount |
|---|---|---|---|
| Open | Lewis Anna S | $285,198 | |
| Closed | Lewis Anna S | $182,000 | |
| Closed | Lewis Anna S | $78,000 |
Source: Public Records
Tax History Compared to Growth
Tax History
| Year | Tax Paid | Tax Assessment Tax Assessment Total Assessment is a certain percentage of the fair market value that is determined by local assessors to be the total taxable value of land and additions on the property. | Land | Improvement |
|---|---|---|---|---|
| 2025 | $37 | $343,800 | $88,400 | $255,400 |
| 2024 | $3,706 | $324,800 | $84,300 | $240,500 |
| 2023 | $3,479 | $289,900 | $76,100 | $213,800 |
| 2022 | $3,551 | $267,600 | $72,000 | $195,600 |
| 2021 | $3,227 | $233,300 | $72,000 | $161,300 |
| 2020 | $3,252 | $233,300 | $72,000 | $161,300 |
| 2019 | $3,003 | $211,800 | $63,700 | $148,100 |
| 2018 | $1,682 | $201,200 | $63,700 | $137,500 |
| 2017 | $2,790 | $193,200 | $63,700 | $129,500 |
| 2016 | $2,637 | $181,500 | $63,700 | $117,800 |
| 2015 | $2,592 | $181,500 | $63,700 | $117,800 |
Source: Public Records
Map
Nearby Homes