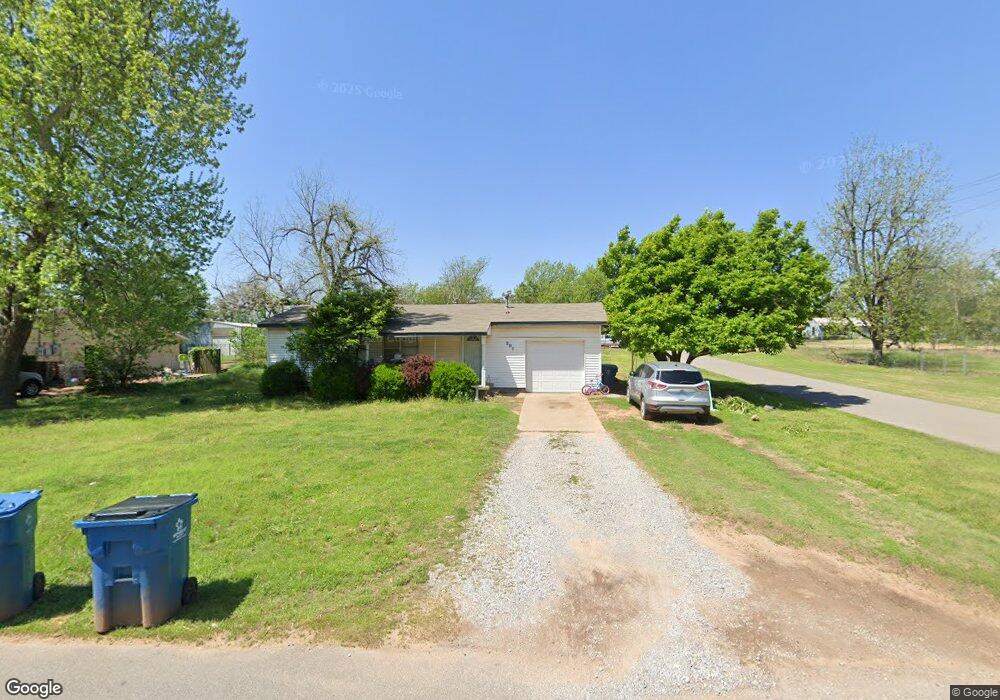
201 SE 2nd St Tuttle, OK 73089
Estimated Value: $104,647 - $150,000
2
Beds
1
Bath
768
Sq Ft
$167/Sq Ft
Est. Value
About This Home
This home is located at 201 SE 2nd St, Tuttle, OK 73089 and is currently estimated at $128,162, approximately $166 per square foot. 201 SE 2nd St is a home located in Grady County with nearby schools including Tuttle Intermediate School, Tuttle Elementary School, and Tuttle Middle School.
Ownership History
Date
Name
Owned For
Owner Type
Purchase Details
Closed on
Feb 27, 2007
Sold by
Mason Carl E and Mason Michelle
Bought by
Malone Wesley
Current Estimated Value
Home Financials for this Owner
Home Financials are based on the most recent Mortgage that was taken out on this home.
Original Mortgage
$66,500
Outstanding Balance
$39,941
Interest Rate
6.21%
Mortgage Type
New Conventional
Estimated Equity
$88,221
Purchase Details
Closed on
Jan 9, 2006
Sold by
Mason Carl E
Bought by
Mason Carl E and Mason Michelle
Purchase Details
Closed on
Mar 1, 2005
Sold by
Owens Justin Lee and Owens Candice Noel
Bought by
Mason Carl E
Home Financials for this Owner
Home Financials are based on the most recent Mortgage that was taken out on this home.
Original Mortgage
$61,650
Interest Rate
5.71%
Mortgage Type
New Conventional
Purchase Details
Closed on
Dec 15, 2004
Sold by
Owens Lydia Sue and Owens Dennis
Bought by
Owens Justin Lee and Owens Candi
Create a Home Valuation Report for This Property
The Home Valuation Report is an in-depth analysis detailing your home's value as well as a comparison with similar homes in the area
Home Values in the Area
Average Home Value in this Area
Purchase History
| Date | Buyer | Sale Price | Title Company |
|---|---|---|---|
| Malone Wesley | $66,500 | None Available | |
| Mason Carl E | -- | None Available | |
| Mason Carl E | $60,000 | None Available | |
| Owens Justin Lee | -- | -- |
Source: Public Records
Mortgage History
| Date | Status | Borrower | Loan Amount |
|---|---|---|---|
| Open | Malone Wesley | $66,500 | |
| Previous Owner | Mason Carl E | $61,650 |
Source: Public Records
Tax History
| Year | Tax Paid | Tax Assessment Tax Assessment Total Assessment is a certain percentage of the fair market value that is determined by local assessors to be the total taxable value of land and additions on the property. | Land | Improvement |
|---|---|---|---|---|
| 2025 | $726 | $6,889 | $1,657 | $5,232 |
| 2024 | $745 | $6,561 | $1,578 | $4,983 |
| 2023 | $745 | $6,249 | $1,715 | $4,534 |
| 2022 | $654 | $5,952 | $1,417 | $4,535 |
| 2021 | $676 | $6,132 | $1,417 | $4,715 |
| 2020 | $689 | $6,187 | $1,417 | $4,770 |
| 2019 | $697 | $6,368 | $1,417 | $4,951 |
| 2018 | $656 | $6,346 | $1,417 | $4,929 |
| 2017 | $675 | $6,362 | $1,417 | $4,945 |
| 2016 | $706 | $6,531 | $1,417 | $5,114 |
| 2015 | $749 | $6,712 | $1,417 | $5,295 |
| 2014 | $749 | $7,315 | $495 | $6,820 |
Source: Public Records
Map
Nearby Homes
- 104 SE 2nd St
- 311 N Cimarron Rd
- 605 SW 4th St
- 309 Elm St
- 502 SW 5th St
- 2 NW 6th St
- 106 Englebretson Ln
- 516 Kings Ct
- 10 Westend Ct
- 1 NW 7th St
- 901 N Cimarron Rd
- 2025 E Rock Creek Rd
- 1301 E Rock Creek Rd
- 1260 E Rock Creek Rd
- 1874 E Rock Creek Rd
- 601 S Frisco Rd
- 903 County Street 2910
- 1300 Ella
- 0 Frisco Rd
- 1330 E Silver City Ridge
Your Personal Tour Guide
Ask me questions while you tour the home.