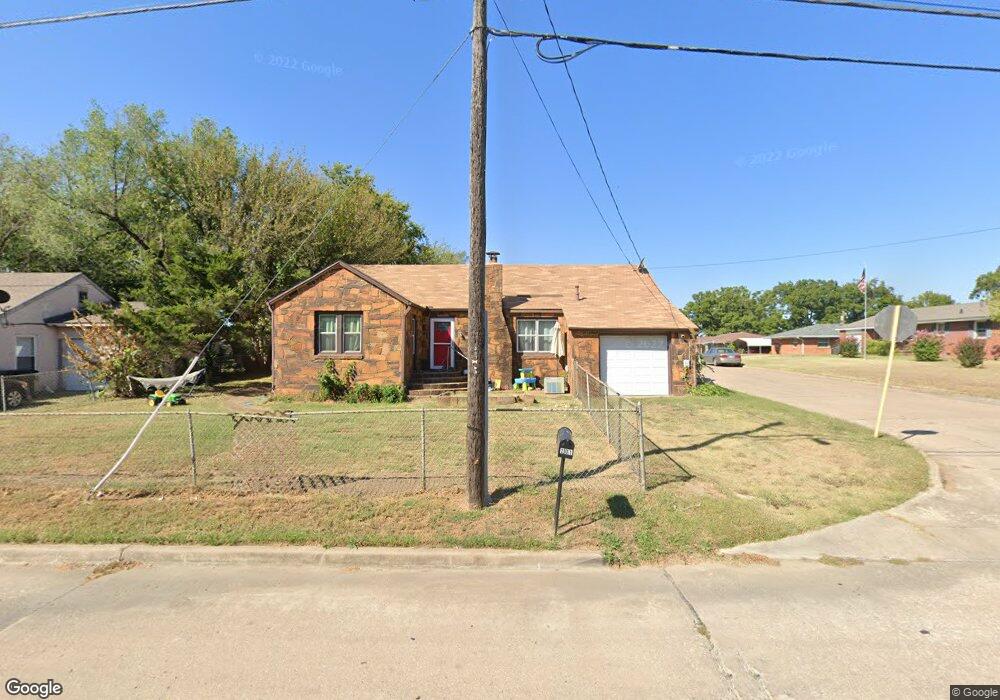
201 SE Waverly Ave Bartlesville, OK 74006
Estimated Value: $103,460 - $138,000
3
Beds
1
Bath
1,176
Sq Ft
$105/Sq Ft
Est. Value
About This Home
This home is located at 201 SE Waverly Ave, Bartlesville, OK 74006 and is currently estimated at $123,115, approximately $104 per square foot. 201 SE Waverly Ave is a home located in Washington County with nearby schools including Hoover Elementary School, Madison Middle School, and Bartlesville High School.
Ownership History
Date
Name
Owned For
Owner Type
Purchase Details
Closed on
Dec 27, 2022
Sold by
Allen R Carey And Donita J Carey Trust
Bought by
Bell Amber
Current Estimated Value
Home Financials for this Owner
Home Financials are based on the most recent Mortgage that was taken out on this home.
Original Mortgage
$79,900
Outstanding Balance
$74,404
Interest Rate
2%
Mortgage Type
New Conventional
Estimated Equity
$48,711
Purchase Details
Closed on
May 15, 2020
Sold by
Carey Allen R and Carey Donita J
Bought by
Carey Allen R and Carey Donita J
Purchase Details
Closed on
Dec 29, 2016
Sold by
Carey Allen Russell
Bought by
Carey Allen R and Carey Donita J
Purchase Details
Closed on
Nov 20, 2011
Sold by
Henry Donna S and Henry Roy
Bought by
Black Wigi B
Purchase Details
Closed on
Jun 29, 2000
Sold by
Warnock Albert Ellsworth
Bought by
Warnock Albert E Fam Tr Albert E & Dori
Create a Home Valuation Report for This Property
The Home Valuation Report is an in-depth analysis detailing your home's value as well as a comparison with similar homes in the area
Home Values in the Area
Average Home Value in this Area
Purchase History
| Date | Buyer | Sale Price | Title Company |
|---|---|---|---|
| Bell Amber | $80,000 | -- | |
| Carey Allen R | -- | None Available | |
| Carey Allen R | -- | None Available | |
| Black Wigi B | -- | None Available | |
| Warnock Albert E Fam Tr Albert E & Dori | -- | -- |
Source: Public Records
Mortgage History
| Date | Status | Borrower | Loan Amount |
|---|---|---|---|
| Open | Bell Amber | $79,900 |
Source: Public Records
Tax History Compared to Growth
Tax History
| Year | Tax Paid | Tax Assessment Tax Assessment Total Assessment is a certain percentage of the fair market value that is determined by local assessors to be the total taxable value of land and additions on the property. | Land | Improvement |
|---|---|---|---|---|
| 2025 | $1,174 | $10,266 | $1,440 | $8,826 |
| 2024 | $1,174 | $9,778 | $1,440 | $8,338 |
| 2023 | $1,174 | $9,778 | $1,440 | $8,338 |
| 2022 | $380 | $3,334 | $394 | $2,940 |
| 2021 | $355 | $3,023 | $350 | $2,673 |
| 2020 | $346 | $2,880 | $330 | $2,550 |
| 2019 | $209 | $2,743 | $312 | $2,431 |
| 2018 | $318 | $2,663 | $302 | $2,361 |
| 2017 | $310 | $2,537 | $285 | $2,252 |
| 2016 | $163 | $2,416 | $269 | $2,147 |
| 2015 | $165 | $2,416 | $269 | $2,147 |
| 2014 | $164 | $2,416 | $269 | $2,147 |
Source: Public Records
Map
Nearby Homes
- 300 SE Waverly Ave
- 328 SE Waverly Ave
- 4513 Tuxedo Blvd
- 4212 Michigan St
- 202 Bradley Place
- 366 SE Wilshire Ave
- 4600 Cara Lee Ln
- 3615 Utah Ave
- 136 SE Debell Ave
- 305 NE Myers Ave
- 397 Fleetwood Dr
- 4507 E Frank Phillips Blvd
- 116 N Spruce Ave
- 404 NE Avondale Ave
- 3317 Tuxedo Blvd Unit B
- 208 NE Spruce Ave
- 220 SE Roselawn Ave
- 4816 Carole Ct
- 440 NE Elmhurst Ave
- 348 N Fenway Ave
- 203 SE Waverly Ave
- 200 SE Waverly Ave
- 205 SE Waverly Ave
- 208 SE Waverly Ave
- 137 SE Waverly Ave
- 146 SE Waverly Ave
- 210 SE Waverly Ave
- 4114 SE Kentucky St
- 212 SE Queenstown Ave
- 221 SE Waverly Ave
- 142 SE Waverly Ave
- 4103 SE Kentucky St
- 216 SE Waverly Ave
- 4106 SE Kentucky St
- 216 SE Queenstown Ave
- 225 SE Waverly Ave
- 138 SE Waverly Ave
- 222 SE Waverly Ave
- 220 SE Queenstown Ave
- 4100 SE Kentucky St