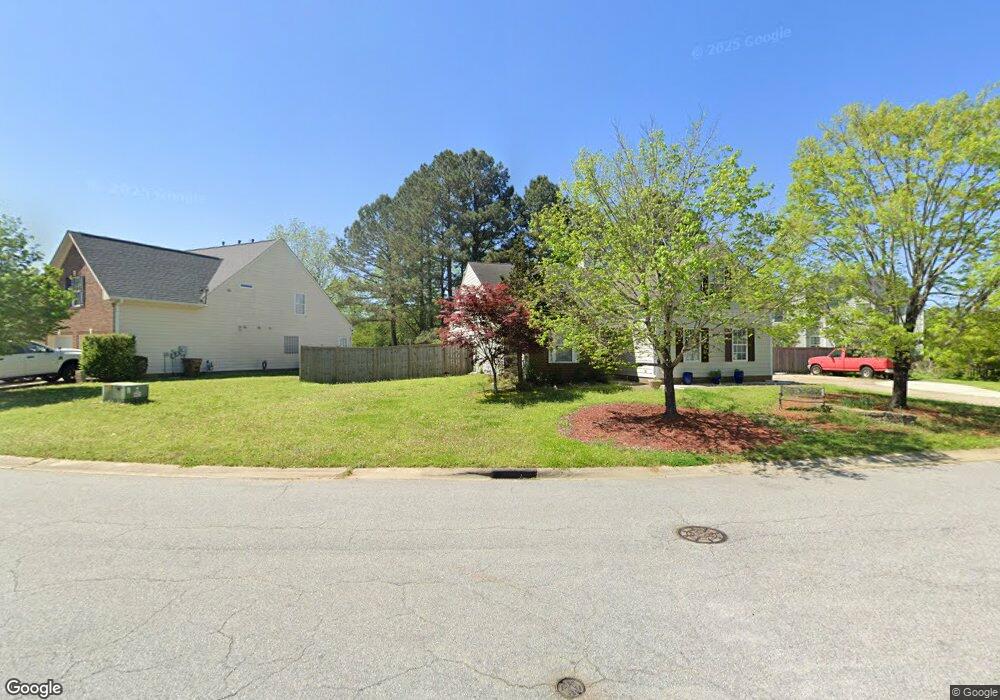
201 Southern Style Dr Holly Springs, NC 27540
Estimated Value: $424,000 - $438,000
3
Beds
2
Baths
1,736
Sq Ft
$249/Sq Ft
Est. Value
About This Home
This home is located at 201 Southern Style Dr, Holly Springs, NC 27540 and is currently estimated at $431,580, approximately $248 per square foot. 201 Southern Style Dr is a home located in Wake County with nearby schools including Holly Grove Elementary School, Holly Grove Middle School, and Holly Springs High School.
Ownership History
Date
Name
Owned For
Owner Type
Purchase Details
Closed on
Apr 19, 2010
Sold by
The Bank Of New York Mellon
Bought by
Ayscue Steven O and Pereira Rocio Goncalves
Current Estimated Value
Home Financials for this Owner
Home Financials are based on the most recent Mortgage that was taken out on this home.
Original Mortgage
$139,120
Outstanding Balance
$92,383
Interest Rate
4.94%
Mortgage Type
New Conventional
Estimated Equity
$339,197
Purchase Details
Closed on
Jan 8, 2009
Sold by
Small Jeffrey J
Bought by
The Bank Of New York Mellon
Purchase Details
Closed on
Aug 5, 2008
Sold by
D R Horton Inc
Bought by
D R Horton Inc Torrey
Purchase Details
Closed on
Dec 5, 2003
Sold by
D R Horton Inc Torrey
Bought by
Small Jeffrey J
Home Financials for this Owner
Home Financials are based on the most recent Mortgage that was taken out on this home.
Original Mortgage
$187,795
Interest Rate
8.62%
Mortgage Type
Purchase Money Mortgage
Create a Home Valuation Report for This Property
The Home Valuation Report is an in-depth analysis detailing your home's value as well as a comparison with similar homes in the area
Home Values in the Area
Average Home Value in this Area
Purchase History
| Date | Buyer | Sale Price | Title Company |
|---|---|---|---|
| Ayscue Steven O | $174,000 | None Available | |
| The Bank Of New York Mellon | $181,800 | None Available | |
| D R Horton Inc Torrey | -- | None Available | |
| Small Jeffrey J | $188,000 | -- |
Source: Public Records
Mortgage History
| Date | Status | Borrower | Loan Amount |
|---|---|---|---|
| Open | Ayscue Steven O | $139,120 | |
| Previous Owner | Small Jeffrey J | $187,795 |
Source: Public Records
Tax History Compared to Growth
Tax History
| Year | Tax Paid | Tax Assessment Tax Assessment Total Assessment is a certain percentage of the fair market value that is determined by local assessors to be the total taxable value of land and additions on the property. | Land | Improvement |
|---|---|---|---|---|
| 2025 | $3,559 | $411,278 | $115,000 | $296,278 |
| 2024 | $3,545 | $411,278 | $115,000 | $296,278 |
| 2023 | $2,972 | $273,646 | $60,000 | $213,646 |
| 2022 | $2,869 | $273,646 | $60,000 | $213,646 |
| 2021 | $2,816 | $273,646 | $60,000 | $213,646 |
| 2020 | $2,816 | $273,646 | $60,000 | $213,646 |
| 2019 | $2,661 | $219,526 | $55,000 | $164,526 |
| 2018 | $2,406 | $219,526 | $55,000 | $164,526 |
| 2017 | $2,320 | $219,526 | $55,000 | $164,526 |
| 2016 | $2,288 | $219,526 | $55,000 | $164,526 |
| 2015 | $2,340 | $221,072 | $50,000 | $171,072 |
| 2014 | $2,259 | $221,072 | $50,000 | $171,072 |
Source: Public Records
Map
Nearby Homes
- 101 Covenant Rock Ln
- 208 Autumn Glen Ln
- 417 Shorehouse Way
- 300 Shorehouse Way
- 100 Oakmoss Trail
- 233 Hickory Glen Ln
- 341 Covenant Rock Ln
- 0 Old Airport Rd
- 1712 Avent Ferry Rd
- 100 Avent Pines Ln
- 161 Summit Oaks Ln
- 304 Magnolia Meadow Way
- 213 Holly Moor Ln
- 305 Martingale Dr
- 933 Hollymont Dr
- 100 Sire Ct
- 512 Cline Falls Dr
- 120 Martingale Dr
- 505 Pyracantha Dr
- 116 Cline Falls Dr
- 301 Southern Style Dr
- 105 Autumn Glen Ln
- 101 Autumn Glen Ln
- 212 Southern Style Dr
- 109 Autumn Glen Ln
- 116 Carolina Town Ln
- 120 Carolina Town Ln
- 208 Southern Style Dr
- 200 Southern Style Dr
- 200 Carolina Town Ln
- 105 Covenant Rock Ln
- 100 Covenant Rock Ln
- 113 Autumn Glen Ln
- 108 Carolina Town Ln
- 204 Carolina Town Ln
- 100 Autumn Glen Ln
- 104 Southern Style Dr
- 104 Covenant Rock Ln
- 104 Autumn Glen Ln
- 104 Carolina Town Ln