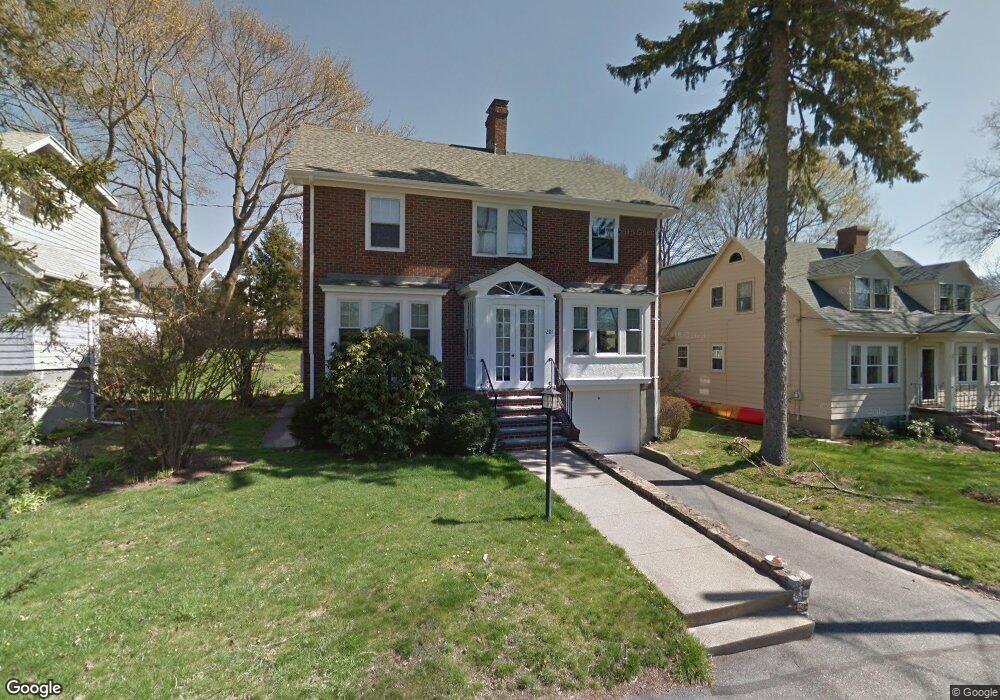
201 Spring St Arlington, MA 02476
Arlington Center NeighborhoodEstimated Value: $1,454,000 - $1,647,000
4
Beds
3
Baths
2,561
Sq Ft
$609/Sq Ft
Est. Value
About This Home
This home is located at 201 Spring St, Arlington, MA 02476 and is currently estimated at $1,558,819, approximately $608 per square foot. 201 Spring St is a home located in Middlesex County with nearby schools including Brackett Elementary School, Ottoson Middle School, and Arlington High School.
Ownership History
Date
Name
Owned For
Owner Type
Purchase Details
Closed on
Dec 8, 2015
Sold by
Glaser James M and Endo Pamella K
Bought by
Lysne Stian K and Lysne Natalie A
Current Estimated Value
Home Financials for this Owner
Home Financials are based on the most recent Mortgage that was taken out on this home.
Original Mortgage
$646,500
Outstanding Balance
$517,339
Interest Rate
3.83%
Mortgage Type
Purchase Money Mortgage
Estimated Equity
$1,041,480
Purchase Details
Closed on
Sep 27, 1993
Sold by
King James E and King Roberta A
Bought by
Glaser James M and Endo Pamela K
Home Financials for this Owner
Home Financials are based on the most recent Mortgage that was taken out on this home.
Original Mortgage
$218,800
Interest Rate
7.1%
Mortgage Type
Purchase Money Mortgage
Create a Home Valuation Report for This Property
The Home Valuation Report is an in-depth analysis detailing your home's value as well as a comparison with similar homes in the area
Home Values in the Area
Average Home Value in this Area
Purchase History
| Date | Buyer | Sale Price | Title Company |
|---|---|---|---|
| Lysne Stian K | $862,000 | -- | |
| Glaser James M | $273,500 | -- |
Source: Public Records
Mortgage History
| Date | Status | Borrower | Loan Amount |
|---|---|---|---|
| Open | Lysne Stian K | $646,500 | |
| Previous Owner | Glaser James M | $165,000 | |
| Previous Owner | Glaser James M | $240,000 | |
| Previous Owner | Glaser James M | $218,800 |
Source: Public Records
Tax History
| Year | Tax Paid | Tax Assessment Tax Assessment Total Assessment is a certain percentage of the fair market value that is determined by local assessors to be the total taxable value of land and additions on the property. | Land | Improvement |
|---|---|---|---|---|
| 2025 | $14,277 | $1,325,600 | $644,800 | $680,800 |
| 2024 | $13,078 | $1,234,900 | $619,000 | $615,900 |
| 2023 | $12,376 | $1,104,000 | $541,700 | $562,300 |
| 2022 | $11,728 | $1,027,000 | $515,900 | $511,100 |
| 2021 | $11,476 | $1,012,000 | $515,900 | $496,100 |
| 2020 | $11,189 | $1,011,700 | $515,900 | $495,800 |
| 2019 | $9,528 | $846,200 | $483,600 | $362,600 |
| 2018 | $9,238 | $761,600 | $399,800 | $361,800 |
| 2017 | $9,160 | $729,300 | $367,500 | $361,800 |
| 2016 | $7,959 | $621,800 | $335,300 | $286,500 |
| 2015 | $8,245 | $608,500 | $328,900 | $279,600 |
Source: Public Records
Map
Nearby Homes
- 2 Bellevue Rd
- 108 Radcliffe Rd
- 93 Churchill Ave
- 10 Lamoine St
- 384 Brighton St
- 36 Kenilworth Rd
- 31 Brunswick Rd
- 115 Gloucester St
- 25 Walnut Terrace
- 14 Albermarle St Unit 14
- 9 Venner Rd
- 303 Gray St
- 27 Stella Rd
- 23 Newman Way Unit 1
- 995 Massachusetts Ave Unit 105
- 995 Massachusetts Ave Unit 404
- 231 Wachusett Ave
- 74 Quincy St
- 1025 Massachusetts Ave Unit 404
- 1025 Massachusetts Ave Unit 204
- 201 Spring St
- 197 Spring St
- 205 Spring St
- 193 Spring St
- 26 Longfellow Rd
- 30 Longfellow Rd
- 236 Highland Ave
- 232 Highland Ave
- 228 Highland Ave
- 244 Highland Ave
- 93 High Haith Rd
- 22 Longfellow Rd
- 202 Spring St
- 222 Highland Ave
- 35 Wall St
- 193 Old Spring St
- 196 Spring St
- 18 Longfellow Rd
- 192 Spring St
- 206 Spring St
Your Personal Tour Guide
Ask me questions while you tour the home.